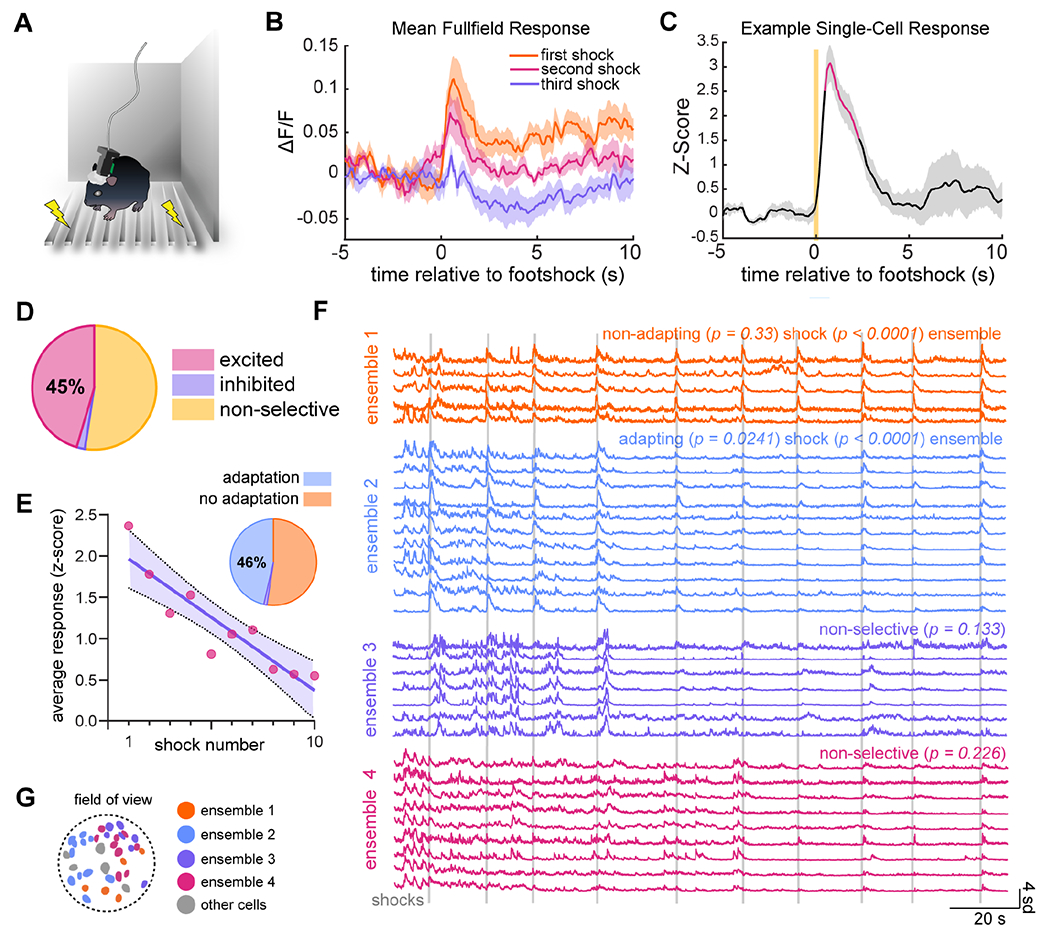
Figure 3. DRN5-HT ensembles adapt to repeated footshocks.

A) Experimental setup showing a mouse with attached miniscope in a small, enclosed arena, standing on metal bars wired to deliver shocks.
B) Population-level response to first, second, and third shocks in the series of ten, averaged across animals (n = 8). Shading represents ±SEM.
C) Example single-cell response as in Fig. 1G.
D) 45% of cells were excited as in (C), 2% were inhibited, and 52% were non-selective (n = 185 cells in 8 animals, shuffle test, α = 0.05).
E) Inverse correlation between response size and shock number in a representative cell. The purple line is a best-fit from linear regression (p = 0.0003, adjusted R2 = 0.826). Shading represents 95% confidence interval. Of excited cells, 46% display this trend (pie chart inset, n = 84 cells in 8 mice, α = 0.05).
F) Four ensembles from a representative animal. Ensemble 1 is excited by footshock (p < 0.0001) and does not significantly adapt to repeated shocks (p = 0.33); ensemble 2 is excited (p < 0.0001) but does adapt (p = 0.0241); and ensembles 3 and 4 are non-selective for footshock (p = 0.226). Vertical gray lines represent individual shocks.
G) Spatial distribution of ensembles shown in (F). Other detected cells are in gray. See also Fig. S5N–O.
