
Figure 5. DRN5-HT ensembles are specifically excited by the first interaction with a novel mouse.
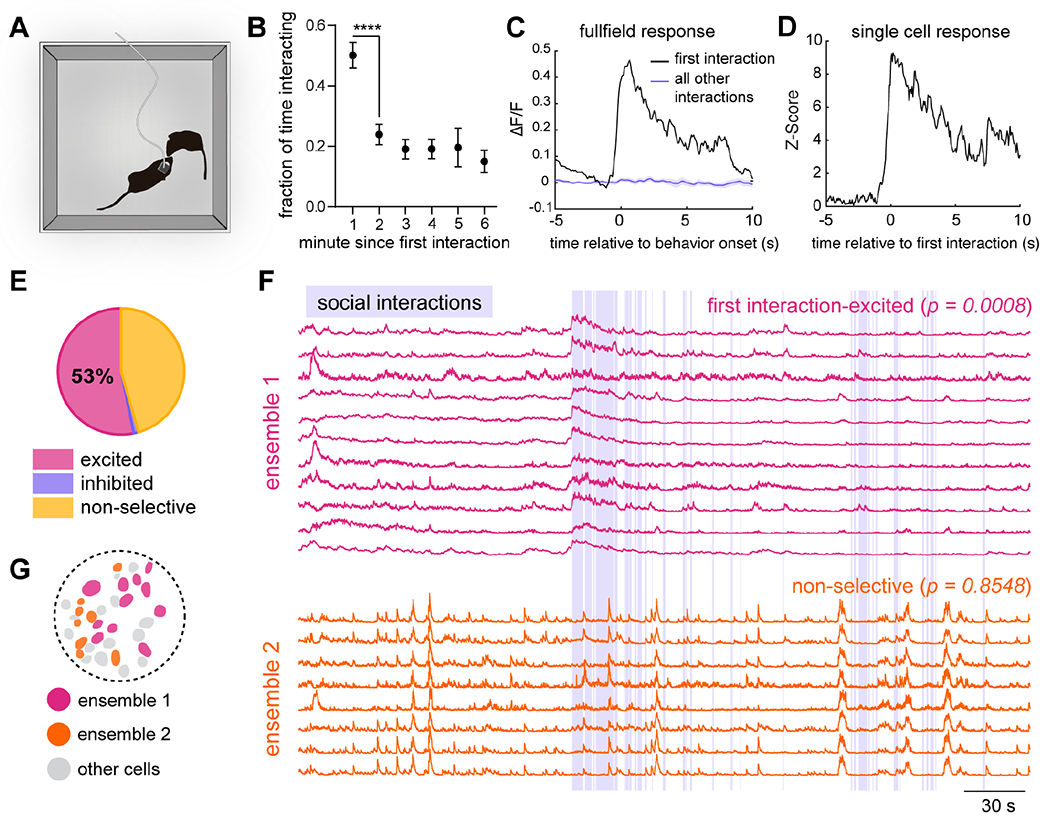
A) Diagram of the social interaction paradigm.
B) Fraction of time mice spend interacting. n = 13 mice (minutes 5 and 6, n = 12 and 11, respectively). Mixed-effects analysis, p = 0.0035. Paired t-test between 1 and 2 minutes, p < 0.0001.
C) Population-level response of a representative animal to the first interaction (black) compared all other interactions (purple). Shading represents ±SEM.
D) Example single cell response to first interaction.
E) Relative proportion of cells with a significant response to the first interaction (53% excited, 215/404 cells, shuffle test, α = 0.05, n = 13 mice).
F) Example ensembles. Ensemble 1 is excited by first interaction (p = 0.0008), while ensemble 2 is non-selective (p = 0.8548). Purple shading represents epochs in which mice are in close physical contact.
G) Spatial distribution of cells in (F).