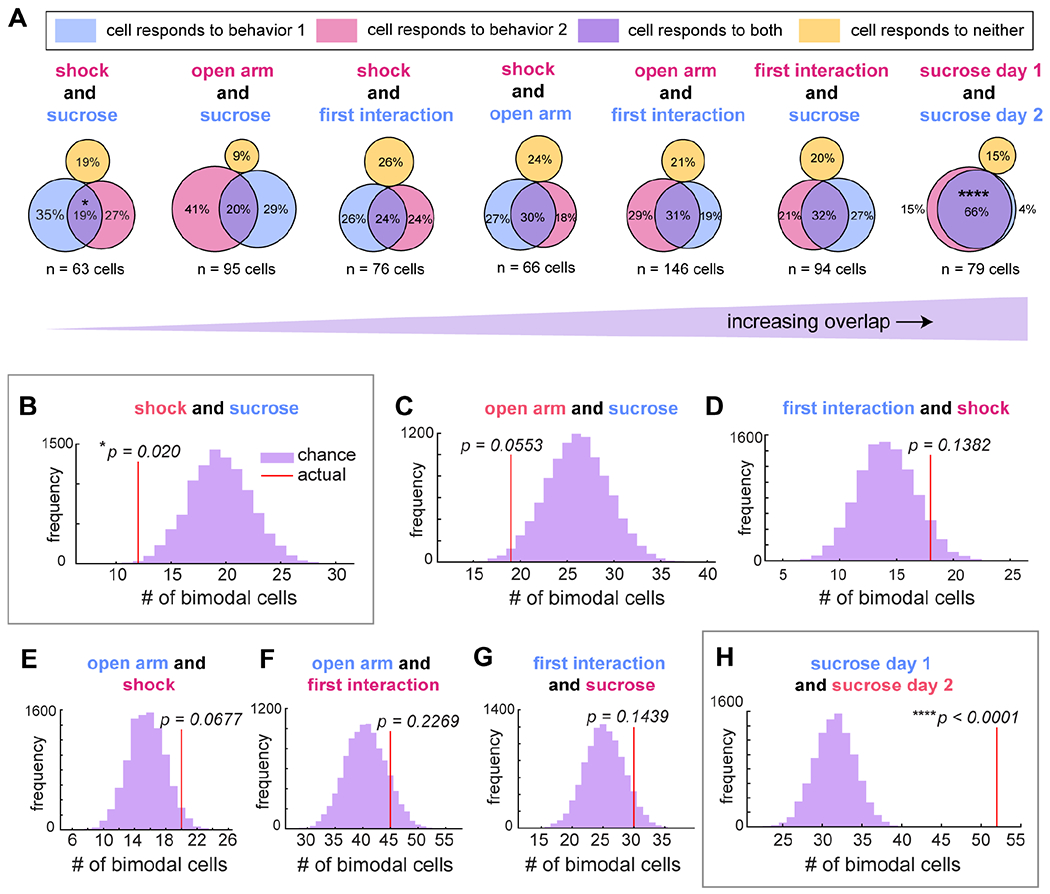
Figure 6. Mixed selectivity of individual DRN5-HT neurons across behavioral tasks.

A) Relative proportions of cells tracked across each pair of behaviors that respond only to one (pink or blue) or to both (purple). Responsiveness was determined as in Fig. 1–5 (shuffle test, α < 0.05). Between sucrose consumption and footshock, overlap was 19% (n = 63 cells, 6 animals); open arm exploration and sucrose consumption, 20% (n = 95 cells in 8 mice); first social interaction and footshock, 24% (n = 76 cells in 6 mice); open arm exploration and footshock, 30% (n = 66 cells in 6 mice); open arm exploration and first interaction, 31% (n = 146 cells in 10 mice); first interaction and sucrose consumption, 32% (n = 94 cells in 8 mice); and two days of sucrose consumption, 66% (n = 79 cells in 6 mice).
B-H) Histograms indicating the likelihood of any number of cells, compared to the actual number observed (red line), responding to both sucrose consumption and footshock ((B), shuffle test, p = 0.020), open arm exploration and sucrose consumption ((C), p = 0.0553), first interaction and footshock ((D), p = 0.1382), open arm exploration and footshock ((E), p = 0.0677), open arm exploration and first interaction ((F), p = 0.2269), first interaction and sucrose consumption ((G), p = 0.1439), and sucrose consumption on two separate days ((H), p < 0.0001). P-values in (B), (C), (D), and (H) have been corrected for 4 comparisons between sucrose consumption and other behaviors using the Bonferroni method. Significantly separate or overlapping populations are highlighted in gray boxes.
