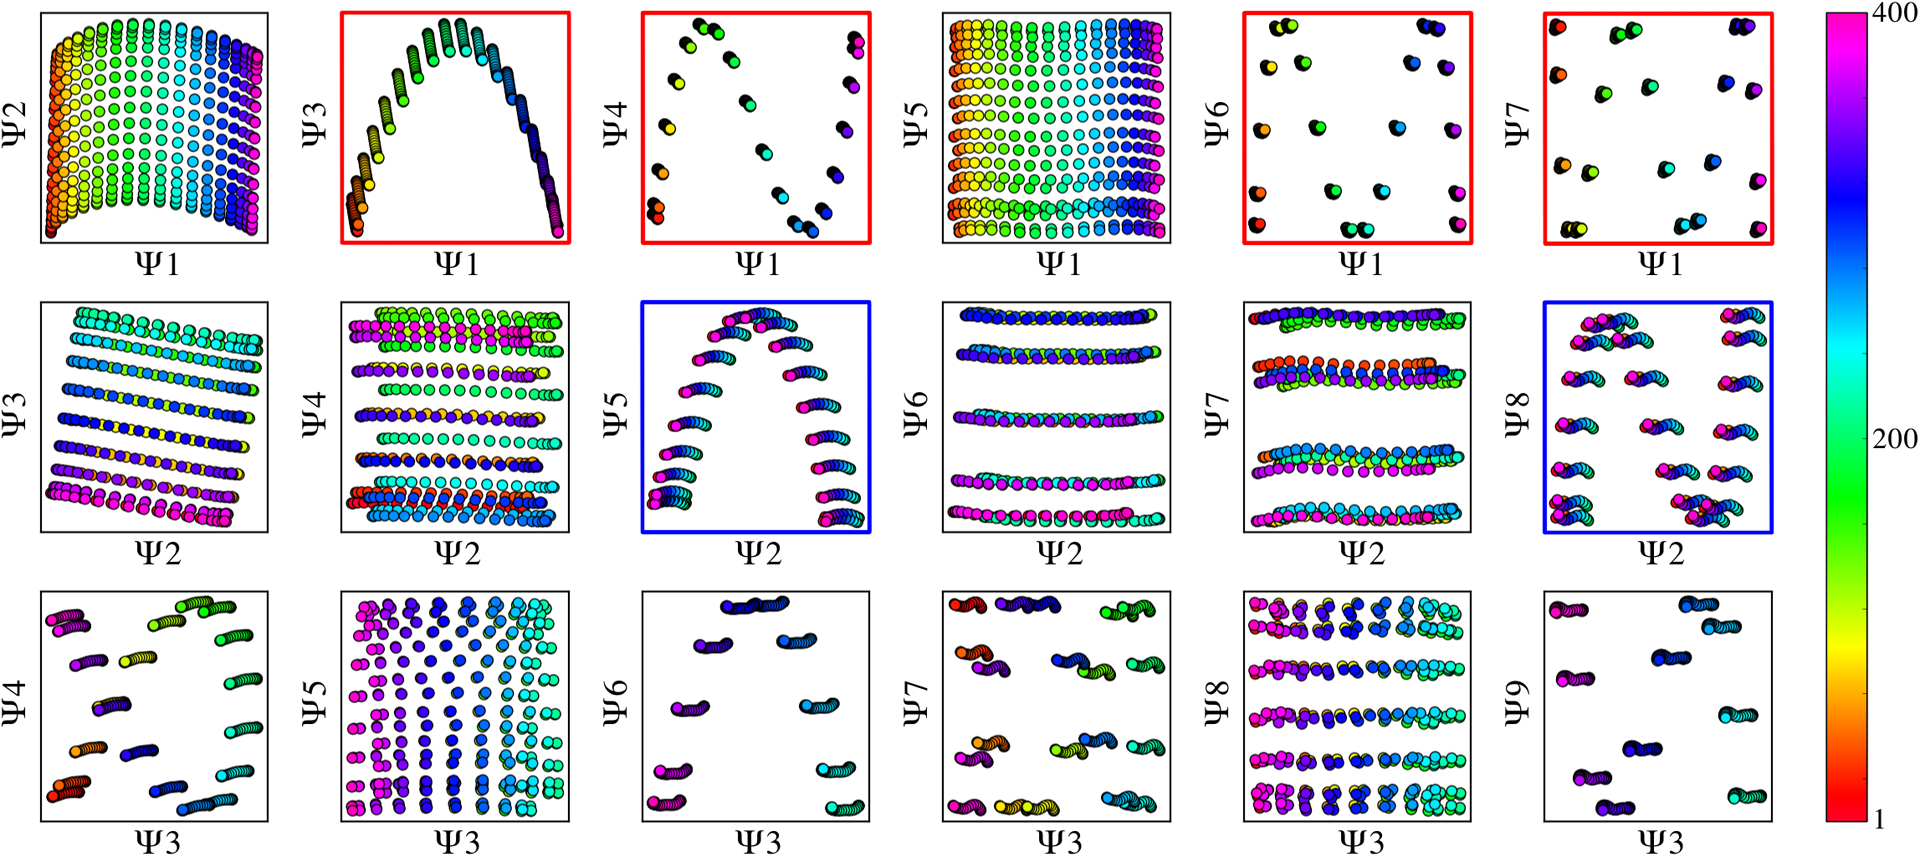
Fig. 2.

The spectral geometry within a subset of 2D subspaces for PD1 in SS2 is shown, as generated via DM. As seen for n > 1, (1) is significantly more complex, with hypersurfaces intermixed. The color map is defined to match the indices of points spanning CM1, such that CM2 points are approximately uniform in color map value (multiples of 20, overlaid).
