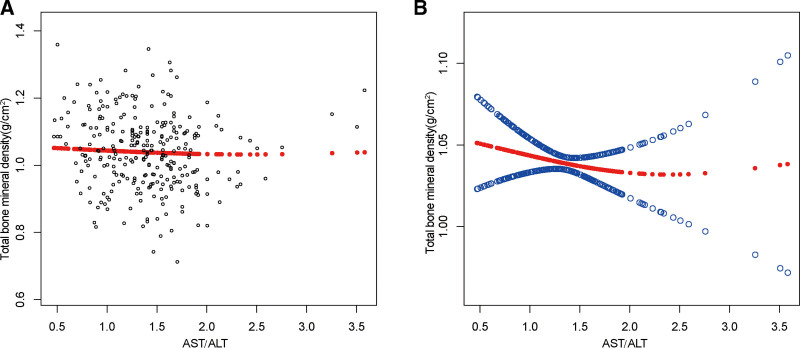
Figure 2.
The association between NAFLD and total bone mineral density. (a) Each black point represents a sample. (b) The solid red line represents the smooth curve fit between variables. Blue bands represent the 95% of confidence interval from the fit. Age, gender, race, body mass index, poverty to income ratio, diabetes status, waist circumference, HbA1c (%), total cholesterol, LDL-cholesterol, HDL-cholesterol, ALT, ALP, GGT, AST, serum iron, total bone mineral density, CAP and LSM were adjusted. ALP = alkaline phosphatase, ALT = alanine aminotransferase, AST = aspartate aminotransferase, CAP = controlled attenuation parameter, GGT = gamma-glutamyl transferase, HbA1c (%) = glycated hemoglobin, HDL = high-density lipoprotein, LDL = low-density lipoprotein, LSM = liver stiffness measure. NAFLD = nonalcoholic fatty liver disease.

