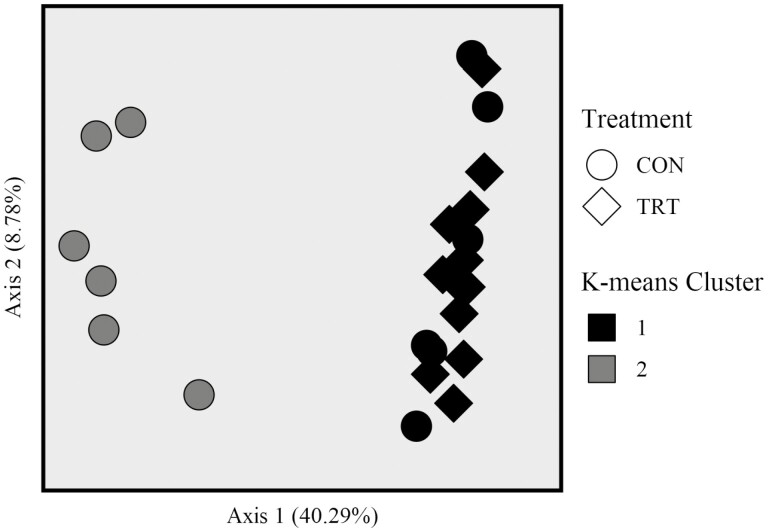
Figure 1.
Principal coordinate analysis of cecal microbial communities from control cattle (CON, round marker) and cattle fed 0.050 g of MicroSaf 4C 40 daily (TRT, diamond marker). Microbiota of cecal CON samples differed from microbiota of cecal TRT samples based on PERMANOVA analysis of unweighted UniFrac distances (P = 0.001, F = 4.235, permutations = 999). Microbiota of cecal samples in K-means group 1 differed from microbiota of cecal samples in K-means group 2 based on PERMANOVA analysis of unweighted UniFrac distances (P = 0.001, F = 14.275, permutations = 999).

