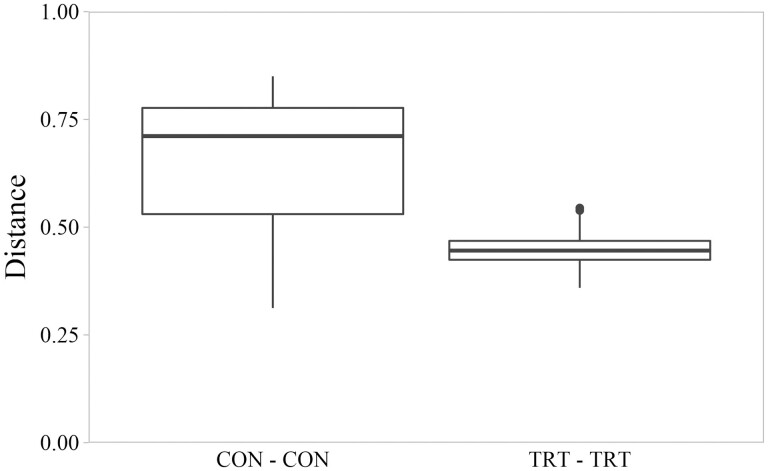
Figure 2.
Pairwise distances between cecal microbial communities based on unweighted UniFrac distance matrix as evaluated by Kruskal–Wallis testing. Box plots represent distances between control cattle (CON) and distances between cattle fed 0.050 g of MicroSaf 4C 40 daily (TRT; supplementation of 2-billion colony forming units of a combination of four species of Bacillus daily). Distances between CON communities were greater than distances between TRT communities (P < 0.001, χ2 = 56.32, df = 1).

