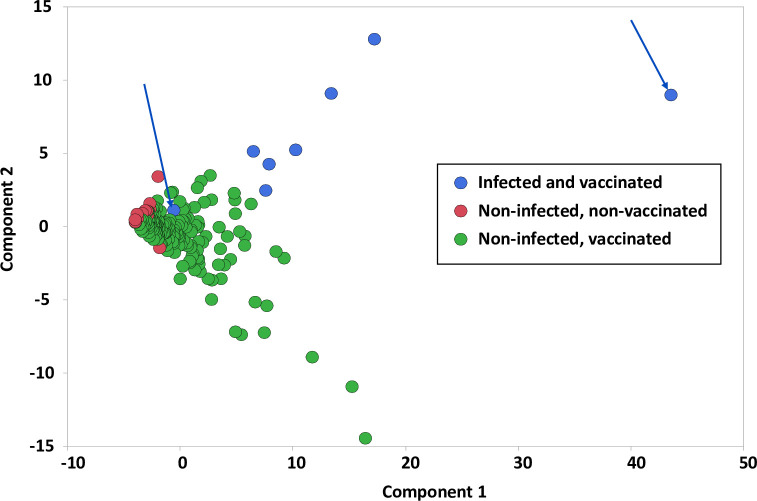
Fig 5. Scatter plot comparison of all subjects.
Component 1 and Component 2 values appear to differentiate participants based on prior infection and vaccination. Participants who were infected and vaccinated had higher Component 2 values reflecting responses to the N and M proteins; however, there are two outlier subjects (blue arrows). In contrast, uninfected and vaccinated participants had lower Component 2 values reflecting the responses to the S protein. Participants who were uninfected and unvaccinated are distinct and cluster around 0.

