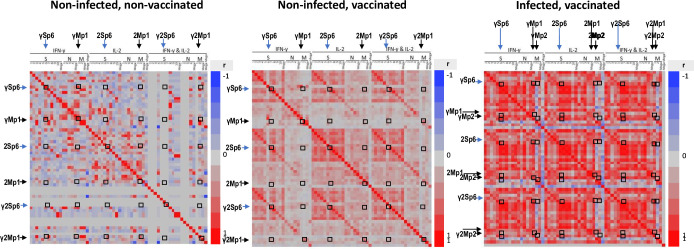
Fig 6. Heat map profiles of all IFN-γ, IL2, and IFN-γ+IL2 responses to each S, N, and M peptide subpool.
Group 1 = uninfected, unvaccinated; Group 2: uninfected, vaccinated; Group 3: infected, vaccinated. All IFN-γ (γ), IL2 (2), and IFN-γ+IL2 (γ2) responses of individual subjects with each S, N and M peptide subpool were compared with each other using the Pearson correlation coefficient (r), a value of “1” is shown in bright red and represents 100% positive correlation, and a value of -1 in bright blue represents 100% negative correlation. Intersection of each parameter is boxed. Sp6 and Mp1: γSp6 and γMp1, 2Sp6 and 2Mp1, and γ2Sp6 and γ2Mp1, were mapped on Groups 1, 2, and 3. Sp6 and Mp2: γSp6 and γMp2, 2Sp6 and 2Mp2, and γ2Sp6 and γ2Mp2, were mapped on Group 3.

