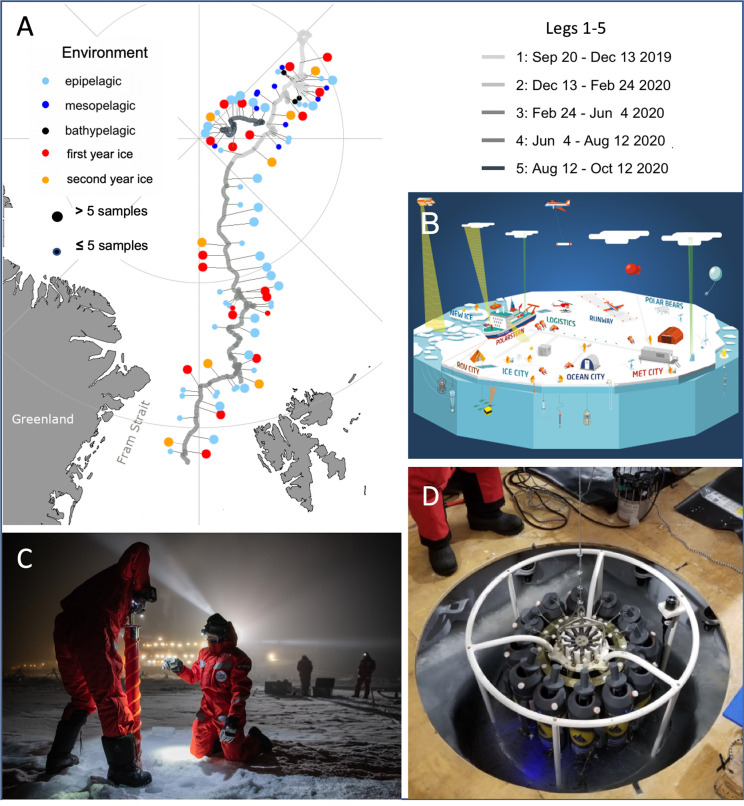
Fig 1. The MOSAiC expedition.
(A) Map showing the route of the Polarstern during its drift throughout the MOSAiC expedition, with pins indicating sampling sites. Daily surface water sampling is shown aggregated by week. Maps were created with ggOceanMaps using basemaps from Natural Earth [8]. (B) Infographic of the drifting ice camp representing diverse scientific groups and their “cities” on the surface of sea ice. Credits Alfred-Wegener Institute. (C) Drilling of sea-ice cores in the dark during leg 2 (December 15, 2019). Credits Esther Horvath. (D) CTD (conductivity, temperature, and depth) rosette for measuring and sampling the sea water underneath sea ice as part of Ocean City. The CTD rosette is lowered through a hole (ca. 1.4 m in diameter) in the sea ice. Credits Ying-Chih Fang.

