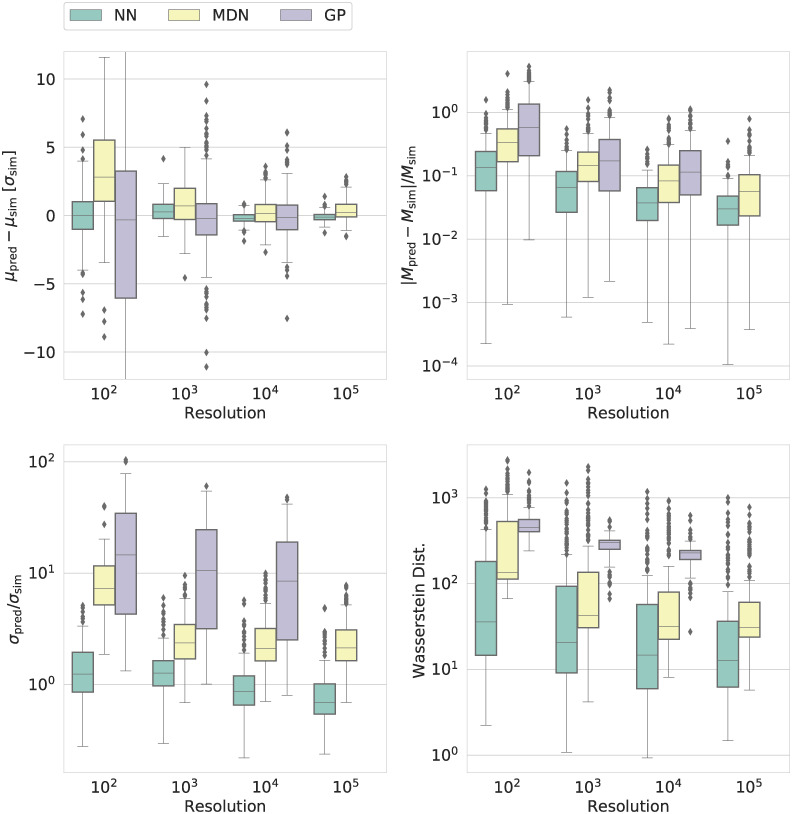
Fig 2. Comparison of the performance of the emulators as a function of the size of the training set (resolution) for the agent-based cellular automata (CA) model of brain tumours.
The plot shows the results for three emulators: A neural network (NN), a mixture density network (MDN), and a Gaussian process (GP). The subscripts ‘pred’ and ‘sim’ refer to the predictions by the emulators and the ground truth obtained from simulations, i.e. the synthetic data, respectively. The four panels contain our four performance metrics for emulators: the error in the predicted mean (μpred), the relative absolute error in the predicted median (Mpred), the ratio between the predicted width of the marginals in terms of the standard deviation (σpred) and true width, and the Wasserstein distance (cf. the section Metrics). The figure summarizes these quantities for one of the output variables of the CA model, the number of glioblastoma stem-like cells (GSC). For the other outputs, we refer the reader to S7 Fig.

