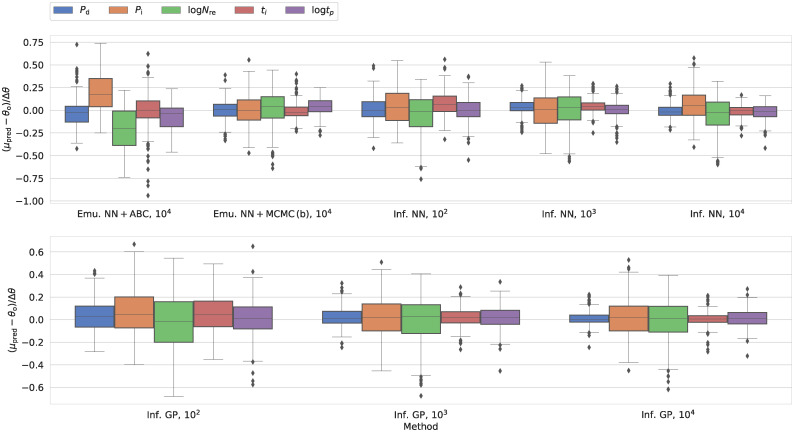
Fig 5. Counterpart to Fig 4 for our epidemiological SIRDS model.
Here, we show the performance across different inference schemes for our SIRDS model in terms of the residuals between the mean of the marginal distribution and the true parameter values (θo) in units of the width of the observed parameter range (Δθ). In contrast to Fig 4, we scale the residuals based Δθ because the different parameters cover very different ranges. For other metrics, we refer the reader to S10 Fig.

