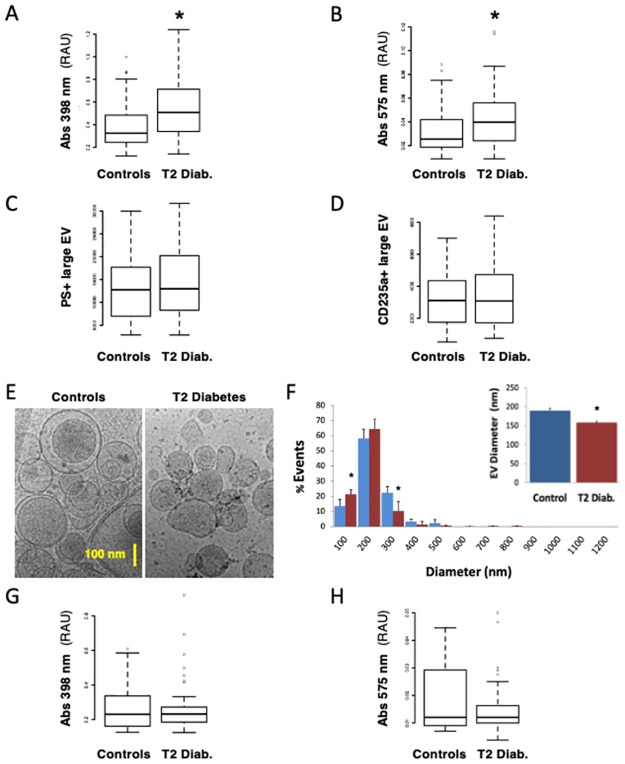
Fig 1. Intravascular hemolysis in patients with type 2 diabetes vs. control subjects.
We quantified direct biomarkers of intravascular hemolysis (IVH) in 109 patients with type 2 diabetes (T2D) vs. 65 non-T2D control subjects, focusing on RBC contents and extracellular vesicles (EV). RBC contents and RBC membrane EV were quantified in platelet-free plasma of control (Blue) vs. T2D patients (Red). Heme-related absorbance was measured at Soret band peaks at 398 nm (A) and 575 nm (B). Circulating large EV were measured by flow-assisted cell sorting after labeling of surface PS with fluorescent annexin-A5 (C) or a RBC-specific anti-CD235a (glycophorin-A) antibody (D). EV from platelet-free plasma were analyzed by cryogenic, transmission electron microscopy (E). EV were identified as objects between 40 and 1200 nm in diameter, with electron-dense membranes and circularity. EV diameters were extracted and presented as size-distribution by 100 nm increments, or as average size (F). Absorbance associated to EV was deduced from signals remaining after depleting EV by ultracentrifugation (25000 g, 4 h) (G-H). (*) p<0.05 vs. Controls.

