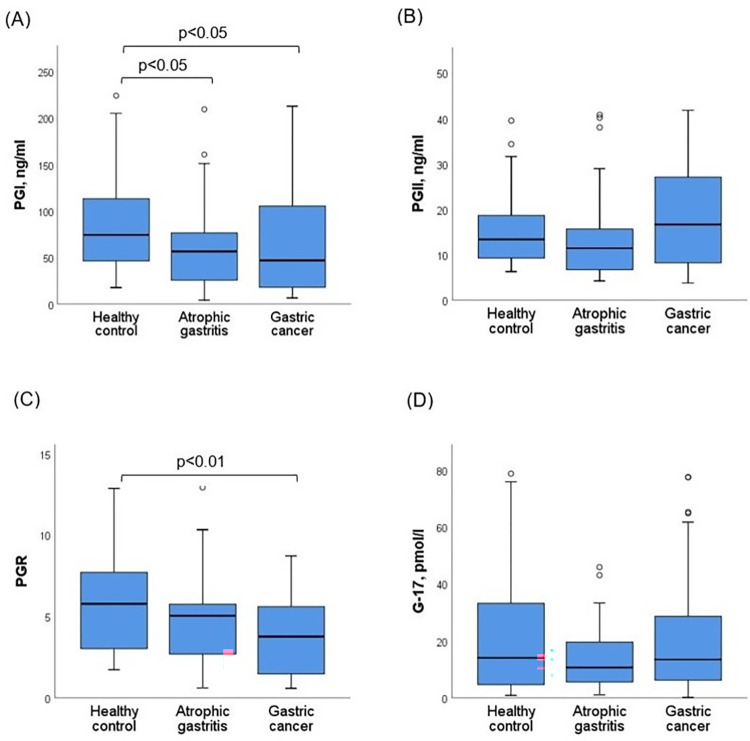
Fig 1.
Comparisons of (A) PGI, (B) PGII, (C) PGR, (D) G-17 biomarkers levels between healthy control and patients with atrophic gastritis and gastric cancer. The graph indicates the medians and the boxes of 25%-75% quartiles. PGI, pepsinogen I; PGII, pepsinogen II; PGR, pepsinogen I to pepsinogen II ratio; G-17, gastrin-17. H. pylori was positive in 67 (58.8%) subjects according to H. pylori IgG assay and there was no difference between study groups. We estimated PGI, PGII, PGR and G-17 levels between H. pylori IgG negative and positive groups. The median of PGI was 46.11 (4.22 to 188.07) and 70.26 (7.53 to 223.94), the median of PGII was 8.40 (3.73 to 41.77) and 15.78 (4.43 to 40.75) for H. pylori IgG negative and positive subjects, respectively. The PGI and PGII levels were higher in H. pylori positive subjects than in H. pylori negative subjects (p<0.01), while there was no difference in PGR and G-17 levels between them. The median of PGR was 4.62 (0.60 to 13.37) and 4.85 (0.58 to 12.86), the median of G-17 was 10.52 (0.11 to 77.49) and 13.69 (1.02 to 78.69) for H. pylori IgG negative and positive subjects, respectively.

