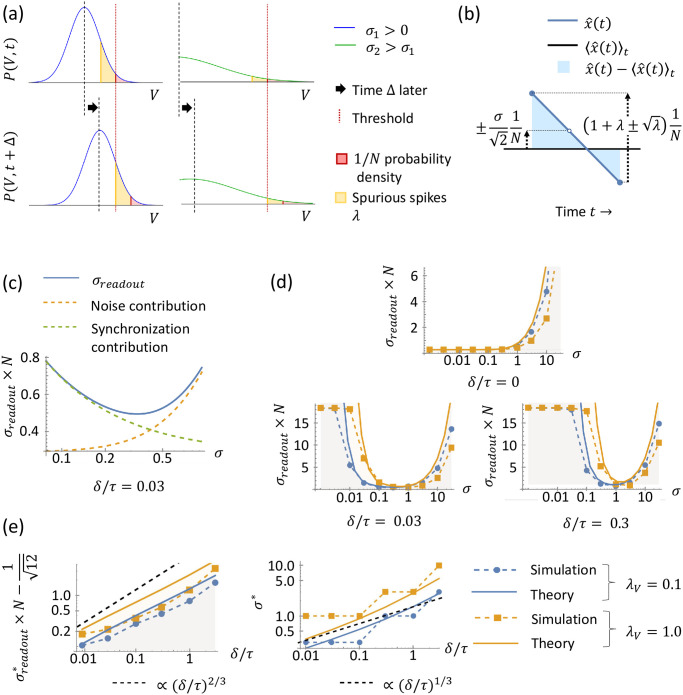
Fig 4. LIF model with nonzero delay.
(a) Calculation of the number of spurious spikes. For a nonzero noise level σ1, the membrane potentials travel in a Gaussian packet with density P(V, t) (blue, top left) toward threshold (vertical red dotted line). The typical position of the packet at the time t when the first neuron spikes is determined by ensuring the tail probability (red, shaded area) above threshold equals 1/N. During the spike propagation delay Δ, the Gaussian packet continues traveling toward threshold (blue, bottom left), and the mean number of spurious spikes λ is given by the additional probability density that crosses threshold (yellow, shaded area). A larger noise level σ2 spreads out the Gaussian packet (green, right), thus reducing λ. (b) Readout (blue) and its deviation (light blue shaded) from the mean . Similar to Fig 3b, the accumulated spike-time variation creates fluctuations in with standard deviation upper-bounded by , but in addition, spurious spikes introduce a Poisson variation in the readout with standard deviation . (c) Integrating the deviations illustrated in (b) yields an approximate upper-bound for σreadout, Eq 24 (blue). Conceptually, σreadout receives contributions from noise (Eq 24 without the λ term; yellow, dashed), and synchronous spurious spikes (Eq 24 without the term; green, dashed). (d) Readout error σreadout for varying levels of noise. For zero delay (top), noise is not necessary to prevent spurious spikes, and thus it strictly increases σreadout. For non-zero delays (bottom), σreadout has a U-shaped dependence on σ, and an optimal noise level σ* exists. The dots/squares on dashed lines represent σreadout from simulations (N = 64), and solid lines are Eq 24, with the region below shaded, indicating upper-bound. Blue signifies λV = 0.1; yellow λV = 1.0. (e) Minimal readout error and optimal noise level σ* as a function of delay δ. Minimizing Eq 24 (with higher-order terms, see Eq S91 in S1 Appendix) with respect to σ yields (left, solid lines) and σ* (right, solid lines). and σ* asymptotically approach (δ/τ)2/3 and (δ/τ)1/3, respectively (dashed black lines). We take the minimal σreadout from the simulations in (d) and the associated optimal noise level to generate the dots/squares on the blue/yellow dashed lines, observing that our theory indeed provides an upper-bound for and a good estimate for the optimal noise level σ* in finite-sized simulations.

