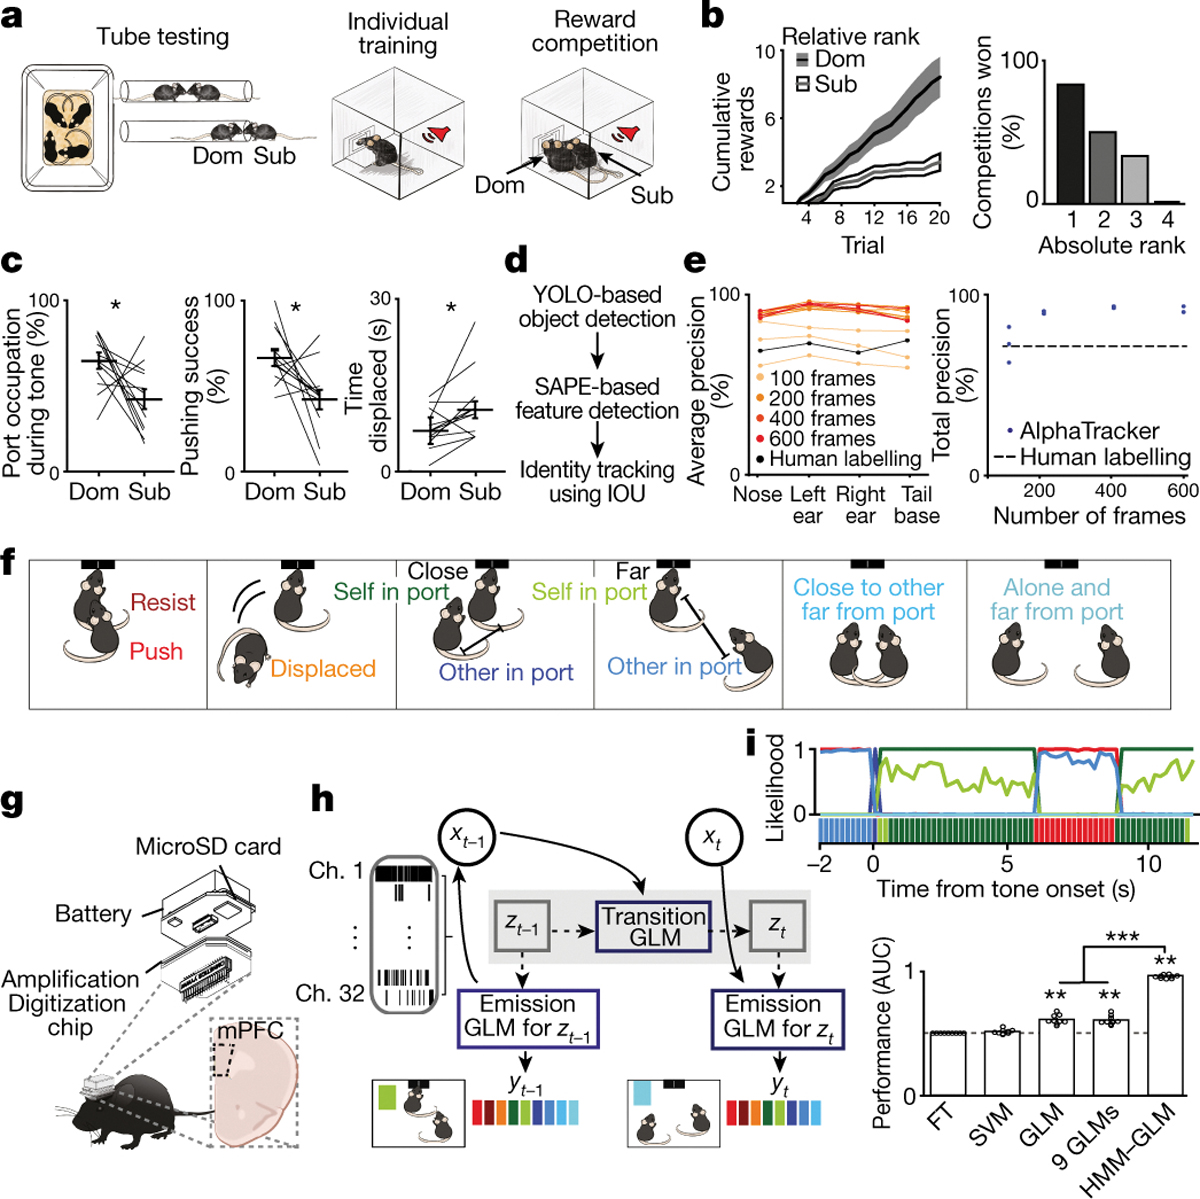
Figure 1: Novel social dominance assay and deep learning tool for tracking multiple animals.

a, Reward competition behavioral paradigm schematic. b, Mice with higher relative ranks (dominant; Dom) collected more rewards than relative subordinates (Sub) when competing in dyads (n=12 dyads; Sign rank test on total rewards, p=0.008). Left, cumulative rewards across trials. Right, percent competitions won by absolute rank (n=6 competitions per rank). c, Port occupation, pushing success (pushing that resulted in displacement of competitor), and time displaced from port was higher for relative dominants (n=12 dyads; Sign rank test, occupation p=0.04; pushing success p=0.02; displaced p=0.016). d, Architecture of AlphaTracker which combines two convolutional neural networks and intersection over union for identity tracking. e, AlphaTracker precision for tracking two unmarked, near-identical mice is higher than human precision separated by body parts (left) or total (right; average precision across body parts; n=3 sub-sampled replicates). f, Left, social competition behavioral labels used for decoder models. g, Wireless device to record neural activity from mPFC (n=965 trials from 32 sessions from 13 mice). Image modified from SpikeGadgets. h, Architecture of the HMM-GLM to model the relationship between neural activity and behavioral states. i, Top, example trial with real behavioral labels and prediction for HMM-GLM 6-state model (colors from Fig. 1f). Bottom, performance across models based on area under the receiver operating curve (AUC; n=9 behaviors; Kruskal Wallis test p=6.7×10⁻⁸; model vs chance sign test p=0.004 for 6 state HMM-GLM, 9 GLMs and GLM; Wilcoxon rank sum HMM-GLM vs GLM p=4×10⁻⁵, HMM-GLM vs 9 GLMs p=4×10⁻⁵, GLM vs 9 GLMs p=0.54). HMM-GLM: hidden Markov model and generalized linear model; FT: frequency of behaviors table; SVM: support vector machine. Data are presented as mean values +/− SEM.
