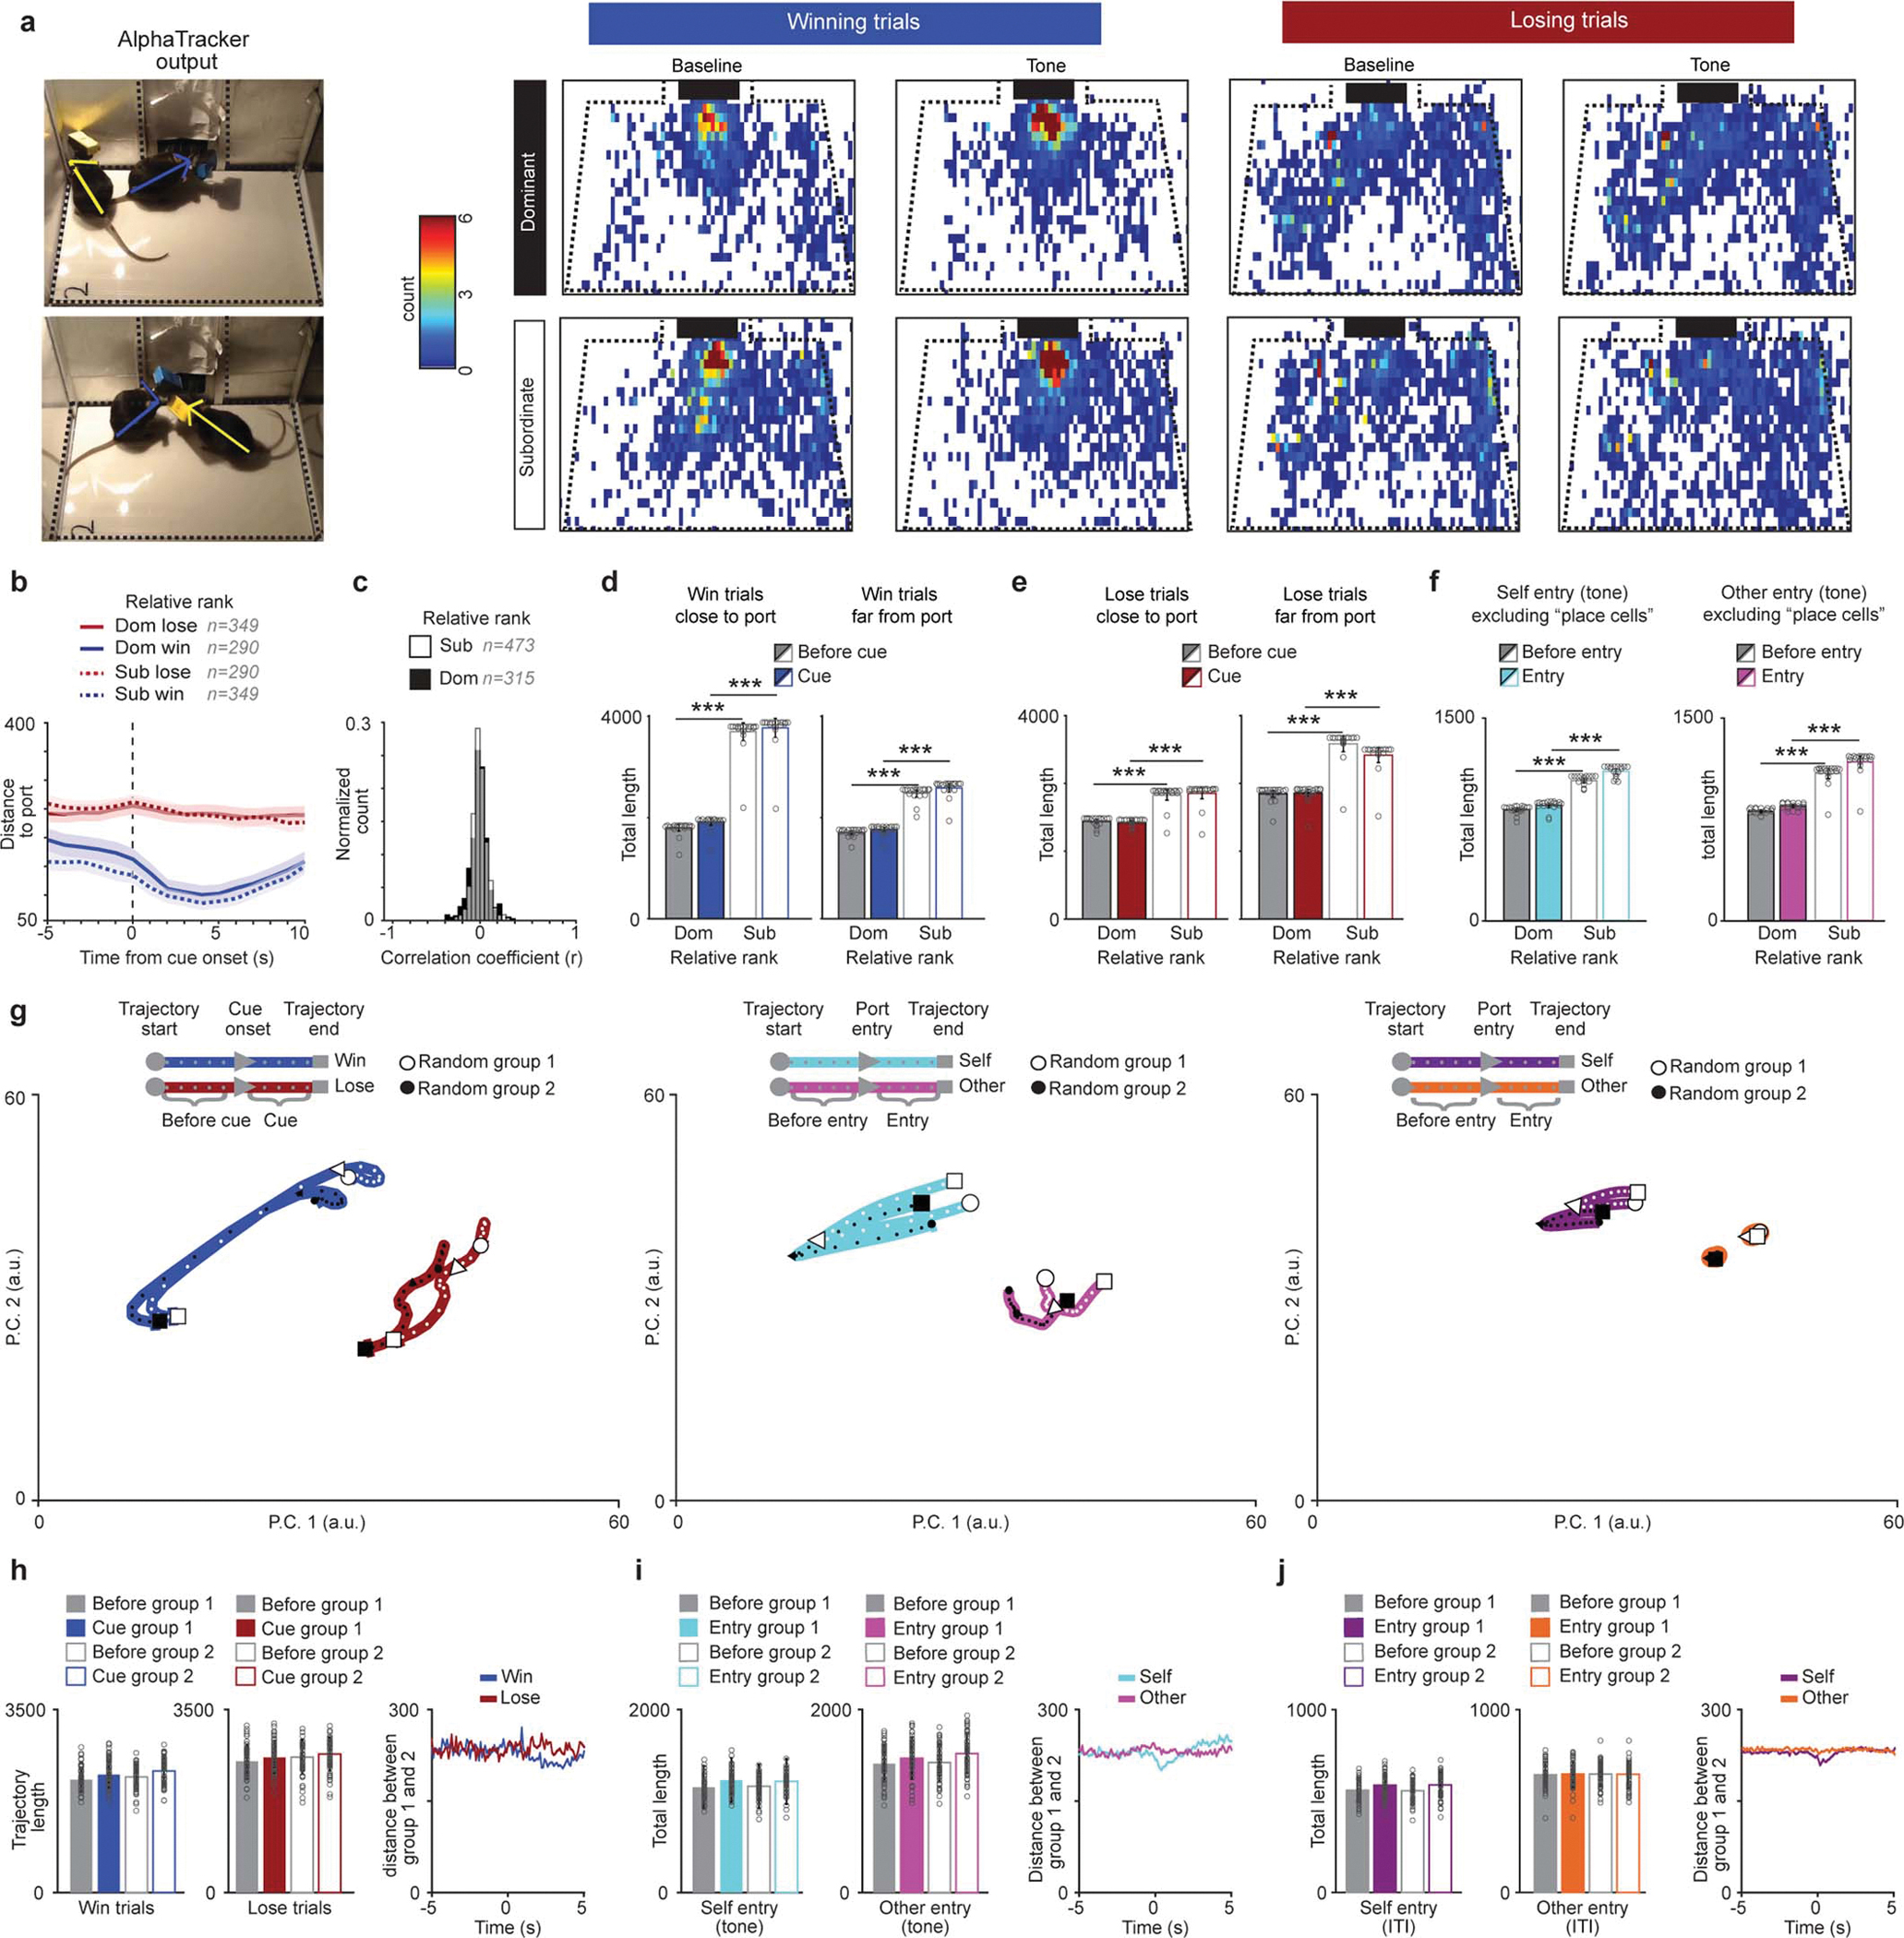
Extended Data Figure 7: mPFC population dynamics during social competition are not driven by location or mouse identity.

a, Average occupation in different parts of the chamber for win vs lose trials for the five seconds prior to tone vs first five seconds of tone. Black squares represent the reward port location. b, Distance to reward port differed by trial-type but not by rank (trials: dom win=290, dom lose=349, sub win=349, sub lose=290; 2-way ANOVA, main effect of trial-type F(1,1274)=353, p=8.8×10−70, rank p=0.098 and interaction p=0.066). c, Distribution of the correlation coefficients for firing rate and distance to port for the population of mPFC single units did not differ by rank (dom=321, sub=479; KS test, p=0.48). d, To determine if distance to reward port affected the population dynamics during win and lose trials a subset of data with matched video conditions was split by distance to reward port. Neural trajectory lengths were higher for relative subordinates during win trials in which mice were close or far to the reward port during tone onset (dom n=19 sessions, sub n=18 sessions; win close to port: 2-way RM-ANOVA main effect of rank F(1,35)=738, p=5×10⁻²¹; win far from port: 2-way RM-ANOVA main effect of rank F(1,35)=588, p=3×10⁻²⁰). e, Neural trajectory lengths were higher for relative subordinates during lose trials in which mice were close or far from reward port during tone onset (dom n=19 sessions, sub n=18 sessions; lose close to port: 2-way RM-ANOVA main effect of rank F(1,35)=588, p=3×10⁻²⁰; lose far from port: 2-way RM-ANOVA main effect of rank F(1,35)=46.7, p=5×10⁻¹¹). f, To determine if reward port “place cells” contributed to neural trajectory rank differences we calculated the neural trajectory lengths without cells that were correlated to distance to port in a subset of data with equivalent video settings (video resolution and camera angle). Left, neural trajectories for self entry during the tone are highest for relative subordinates without the distance correlated cells (dom n=18 sessions, sub n=18 sessions; 2-way RM-ANOVA main effect of rank F(1,34)=94.4, p=1×10⁻¹³). Right, neural trajectories are highest for relative subordinates without the distance correlated cells (dom n=18 sessions, sub n=18 sessions; excluding correlated cells: 2-way RM-ANOVA main effect of rank F(1,34)=100, p=1×10⁻¹³). g, Neural trajectories of mPFC population activity for two randomly selected halves of the data for (left) win and lose trials, (middle) port entries during the tone and (right) ITI port entries (data from 49 recording sessions from 20 mice). All trajectories reflect the mean trajectories across 50 bootstrapping iterations. h, Left, trajectory lengths for win and lose trials when data is divided randomly show no effect of group indicating that the effect of rank is not due to chance (n=50; win: 2-way ANOVA, event F(1,196)=8.41, p=0.004, group p=0.62; lose: event p=0.13, group p=0.65). Right, mean trajectory distances between groups for win and lose trials. i, Left, trajectory lengths for port entries during the tone when data is divided randomly show no effect of group (n=50; self entry: 2-way ANOVA, event F(1,196)=14.2, p=0.0002, group p=0.97; other entry: F(1,196)=6.76, p=0.01, group p=0.31). Right, mean trajectory distances between groups for self entry and other entry during the tone. j, Left, trajectory lengths for ITI port entries when data is divided randomly show no effect of group (n=50; self entry: 2-way ANOVA, event F(1,196)=10.3, p=0.001, group p=0.93; other entry: event p=0.96, group p=0.87). Right, mean trajectory distances between groups for self entry and other entry during the ITI.
