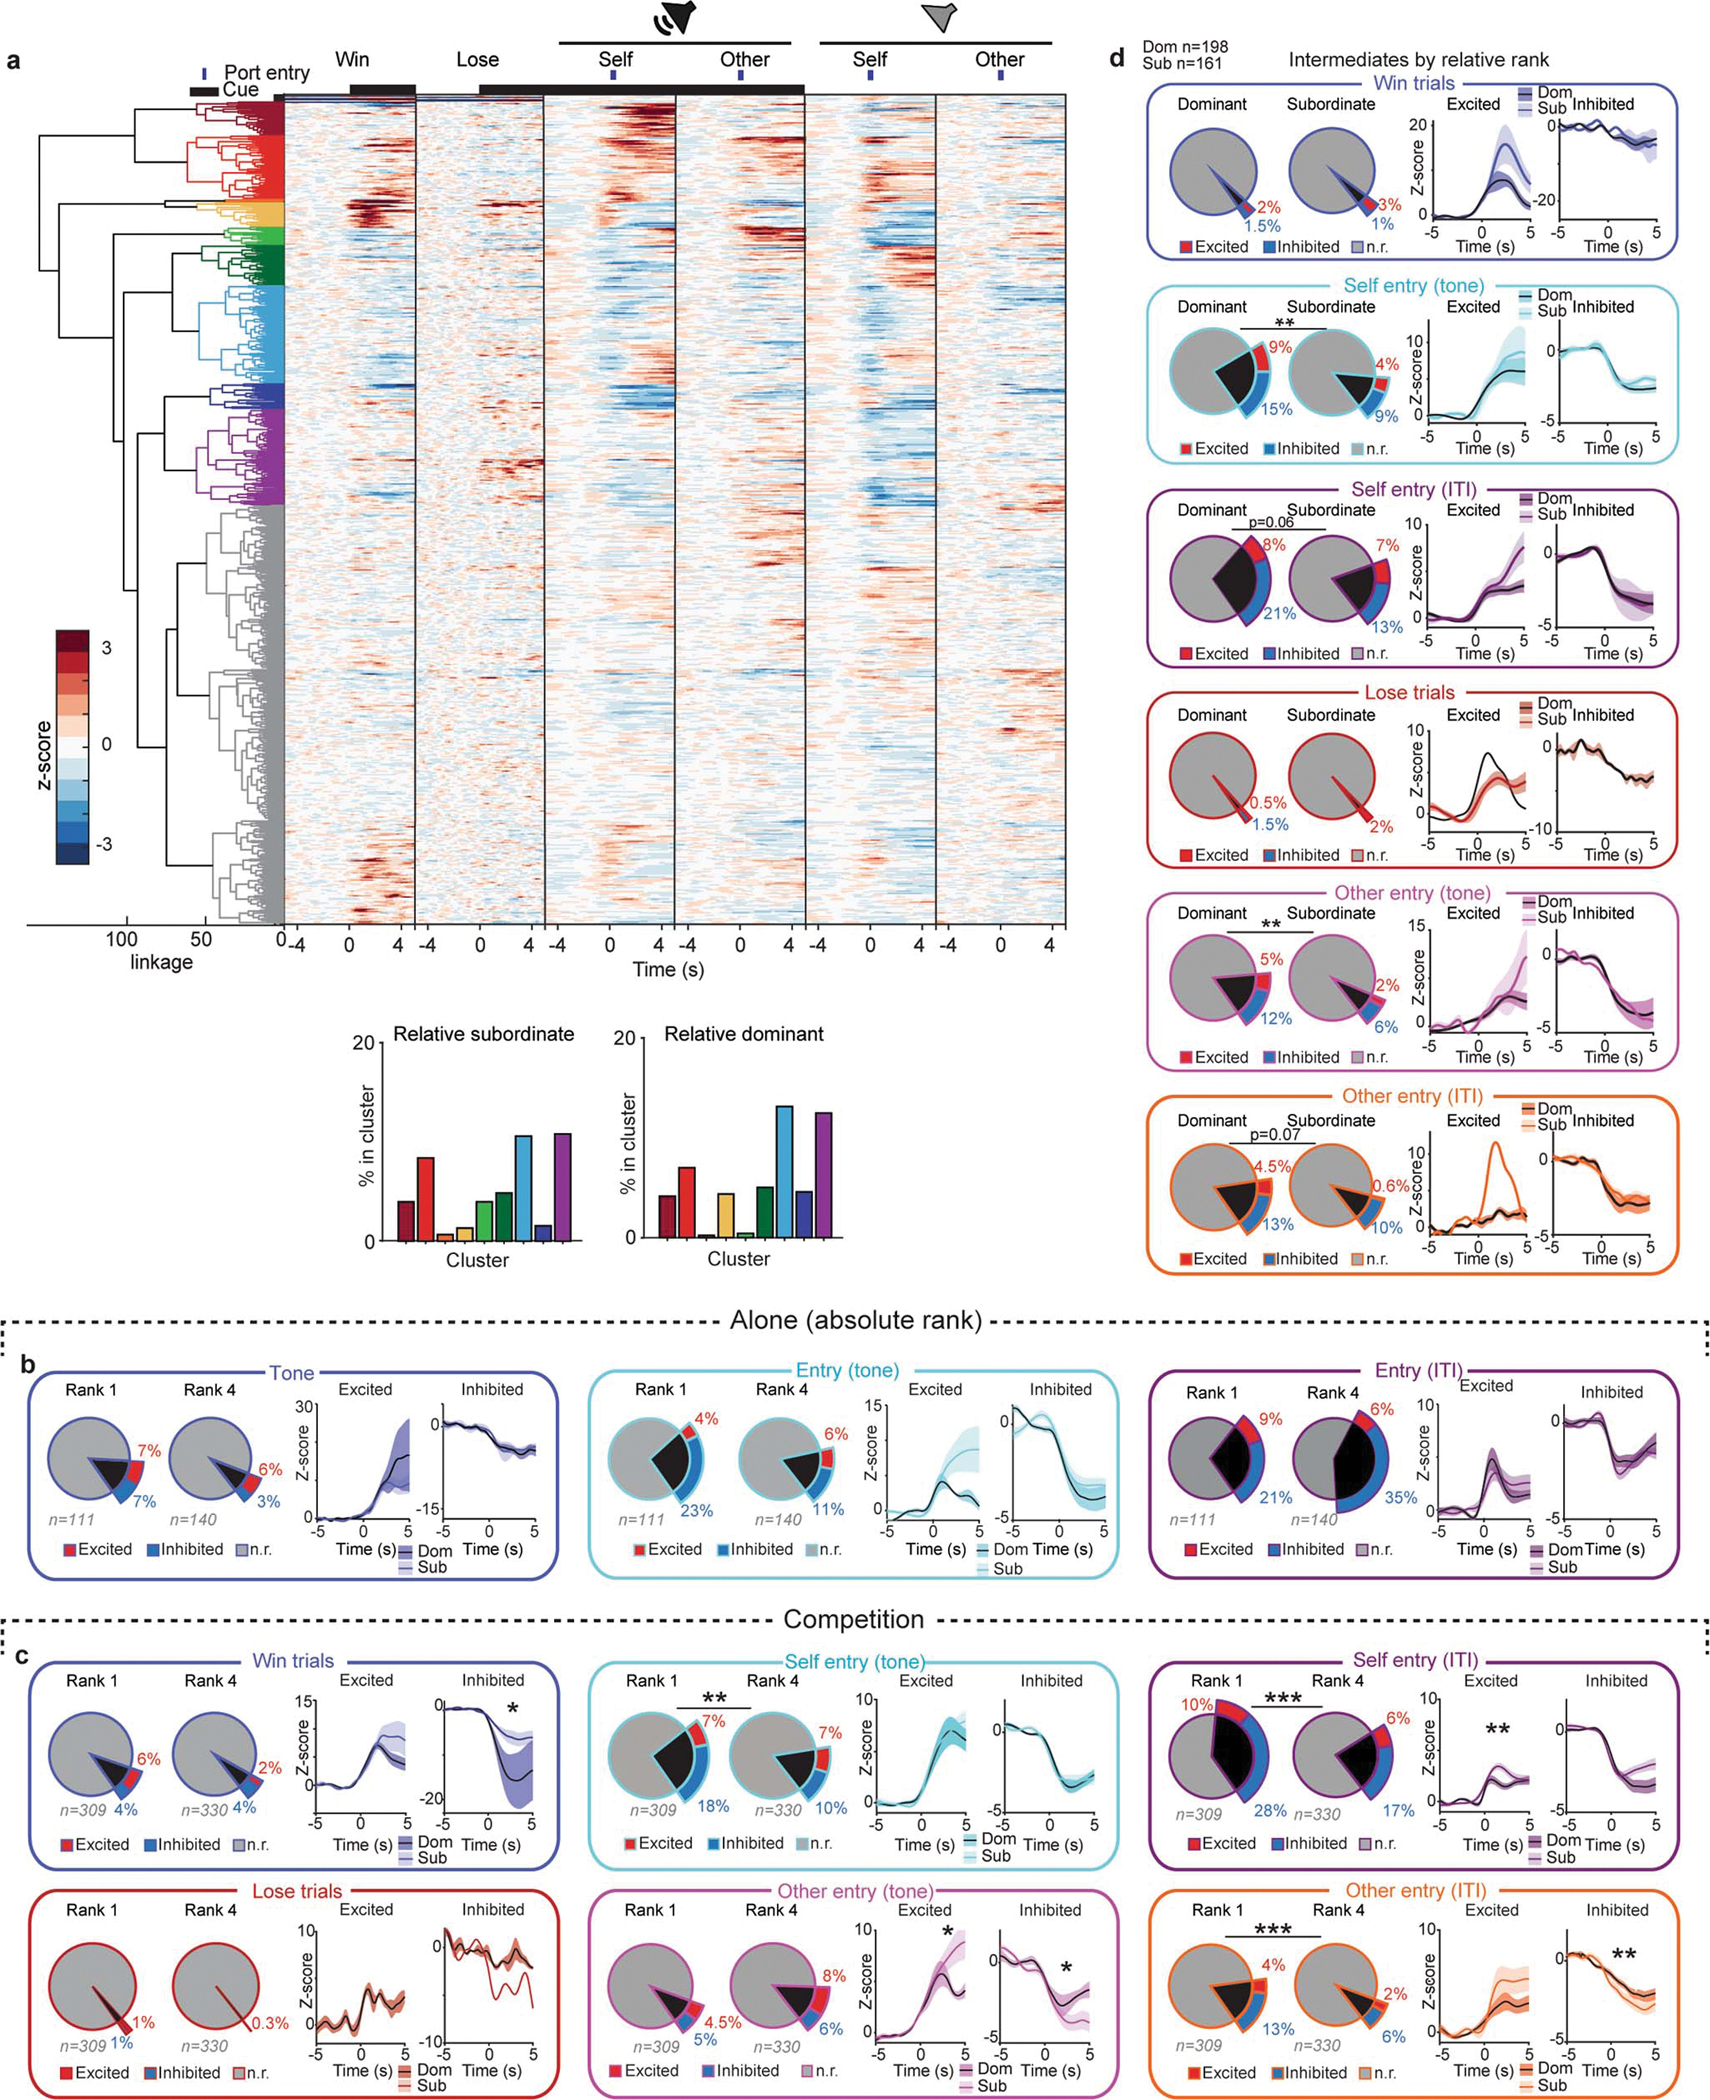
Extended Data Figure 9: Additional data for mPFC single unit responses to task-relevant events during social competition.

a, Top, Dendrogram for functional clusters and heatmap of mean firing rate for all the neurons included in the hierarchical clustering (n=913 cells). Gray cells in the dendrogram indicate cells in functional clusters that did not meet criteria of mean z-score being higher than 2 or lower than −1 for at least one event. Bottom, distribution of mPFC cells across functional clusters in relative subordinates and relative dominants. b, Left, mPFC tone responsive cells when mice perform the reward task alone. Number of responsive cells and response magnitude to the tone does not differ between rank 1 and rank 4 mice (rank 1 exc=8 rank 1 inh=8 rank 4 exc= 8 rank 4 inh=4; Fisher’s exact test, total responsive per group p=0.16; Wilcoxon rank sum across groups: exc p=0.87, inh p=1.0). Middle, mPFC tone port entries responsive cells when mice perform the reward task alone. Number of responsive cells and response magnitude to port entries during tone does not differ across dom (rank 1) vs sub (rank 4) mice (dom exc=5 dom inh=25 sub exc=9 sub inh=16; Fisher’s exact test, total responsive per group p=0.09; Wilcoxon rank sum across groups: exc p=0.23, inh p=0.62). Right, mPFC inter trial interval (ITI) port entries responsive cells when mice perform the reward task alone. Number of responsive cells and response magnitude to port entries during ITI does not differ between rank 1 and rank 4 mice (rank 1 exc=10, rank 1 inh=23 rank 4 exc=9 rank 4 inh=49; Fisher’s exact test, total responsive per group p=0.06; Wilcoxon rank sum across groups: exc p=0.84, inh p=0.17). c, Total responsive cells and response magnitude to task-relevant event during social competition for absolute rank 1 vs rank 4 (win trials: dom exc=20, dom inh=11, sub exc=7, sub inh=14, Fisher’s exact test p=0.11, Wilcoxon rank sum exc p=0.23, inh p=0.03; lose trials: dom exc=3 dom inh=3, sub exc=0, sub inh=1, Fisher’s exact test p=0.12, Wilcoxon rank sum inh p=0.50; self entries tone: dom exc=23, dom inh=57, sub exc=24, sub inh=32, Fisher’s exact test p=0.006, Wilcoxon rank sum exc p=0.42, inh p=0.77; other entries tone: dom exc=14, dom inh 16, sub exc=27, sub inh=19, Fisher’s exact test p=0.11, Wilcoxon rank sum exc p=0.049, inh p=0.04; self entries ITI dom exc=31, dom inh=89, sub exc=21, sub inh=56, Fisher’s exact test p=2×10⁻⁵, Wilcoxon rank sum exc p=0.01, inh p=0.41; other entries ITI dom exc=13, dom inh=41, sub exc=8, sub inh=21, Fisher’s exact test p=0.001, Wilcoxon rank sum exc p=0.11, inh p=0.008). d, Total responsive cells and response magnitude to task-relevant event during social competition for intermediate rank mice (ranks 2 and 3) by relative rank (win trials: dom exc=4, dom inh=3, sub exc=5, sub inh=2, Fisher’s exact test p=0.76, Wilcoxon rank sum exc p=0.11, inh p=0.80; lose trials: dom exc=1 dom inh=3, sub exc=3, sub inh=0, Fisher’s exact test p=1, Wilcoxon rank sum exc p=1; self entries tone: dom exc=17, dom inh=30, sub exc=7, sub inh=14, Fisher’s exact test p=0.01, Wilcoxon rank sum exc p=0.89, inh p=0.57; other entries tone: dom exc=10, dom inh 23, sub exc=3, sub inh=10, Fisher’s exact test p=0.01, Wilcoxon rank sum exc p=0.46, inh p=0.79; self entries ITI dom exc=15, dom inh=42, sub exc=11, sub inh=21, Fisher’s exact test p=0.06, Wilcoxon rank sum exc p=0.11, inh p=0.44; other entries ITI dom exc=9, dom inh=26, sub exc=1, sub inh=16, Fisher’s exact test p=0.07, Wilcoxon rank sum exc p=0.20, inh p=0.90).
