
Figure 2: Social rank and competitive success is decoded by mPFC population dynamics.
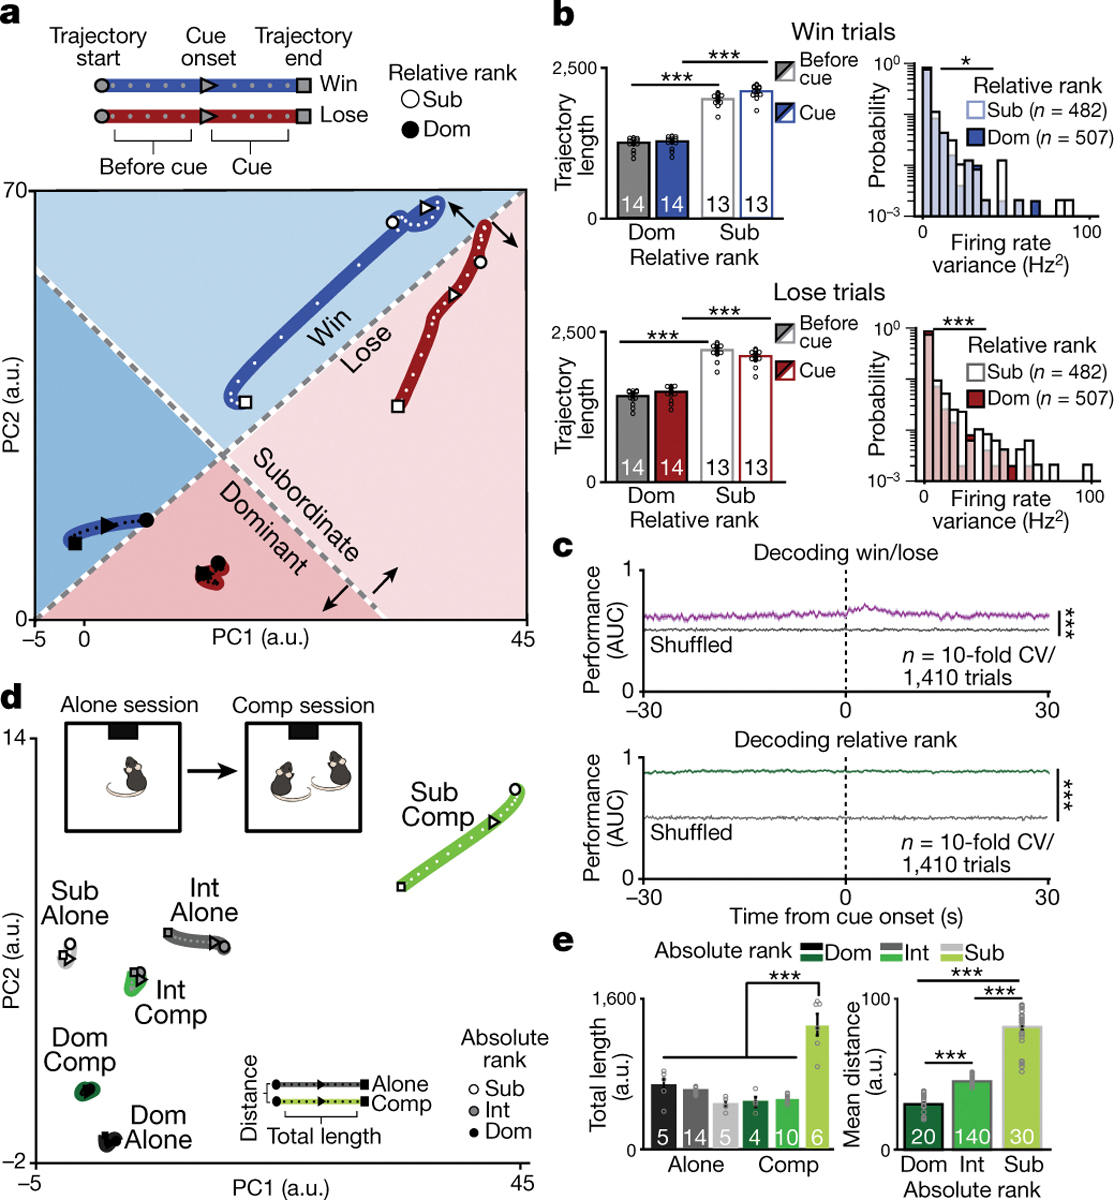
a, Neural trajectories of mPFC firing rate differ by relative rank during the tone presentation for win and lose trials in a lower dimensional common principal component (PC) sub-space (trajectories include a total of 20 mice, 27 sessions dominants: n=507 cells; subordinates: n=490 cells). b, Neural trajectory lengths for win (top left; 2-way RM-ANOVA effects of relative rank F(1,25)=1090,p=2×10⁻¹⁶ and interaction,F(1,25)=1660,p=3×10⁻¹⁴) and lose (bottom left; 2-way RM-ANOVA effect of relative rank F(1,25)=883,p=9×10⁻¹⁶ and interaction, F(1,25)=2995,p=9×10⁻¹⁶) trials. Firing rate variance is higher for relative subordinates (right bottom; number of neurons indicated in plots; win trials: KS test p=0.01, Wilcoxon rank-sum p=0.19; lose trials KS test p=5×10⁻⁷, Wilcoxon rank-sum p=2×10⁻⁹). c, SVM performance is higher than chance for decoding competitive success and relative rank (area under the receiving operating curve: AUC; gray: shuffled data performance; Wilcoxon rank-sum: competitive success p=2×10⁻⁴, relative rank p=2×10⁻⁴; Competitive success vs relative rank p=2×10⁻⁴). d, Neural trajectories of mPFC population firing rate by absolute rank (dominant (Dom)= rank 1; intermediates (Int)=ranks 2&3; subordinate (Sub)= rank 4) when performing the reward task alone vs in competition in a lower dimensional common PC sub-space (neurons in alone session: Dom=111, Int=259, Sub=140; competition: Dom=309, Int=359, sub=330). e, Left, trajectory during the tone is higher for subordinates during competition (2-way ANOVA main effect of rank F(2,38)=30.4, p=1×10⁻⁸, task F(1,38)=26.1, p=9×10⁻⁶ and interaction F(2,38)=70.1, p=1×10⁻¹³). Right, distance between alone and competition tone trajectories increases with rank (n reflects all possible combinations of alone vs competition trajectories;1-way ANOVA main effect of rank F(2,187)=536, p=3×10−78). Post-hoc comparisons are Bonferroni-corrected t-tests, **p<0.01, ***p<0.001. 2-way ANOVAs were for rank and event (baseline vs event) or rank and trial-type and sample size indicated in plots. Data are presented as mean +/− SEM.