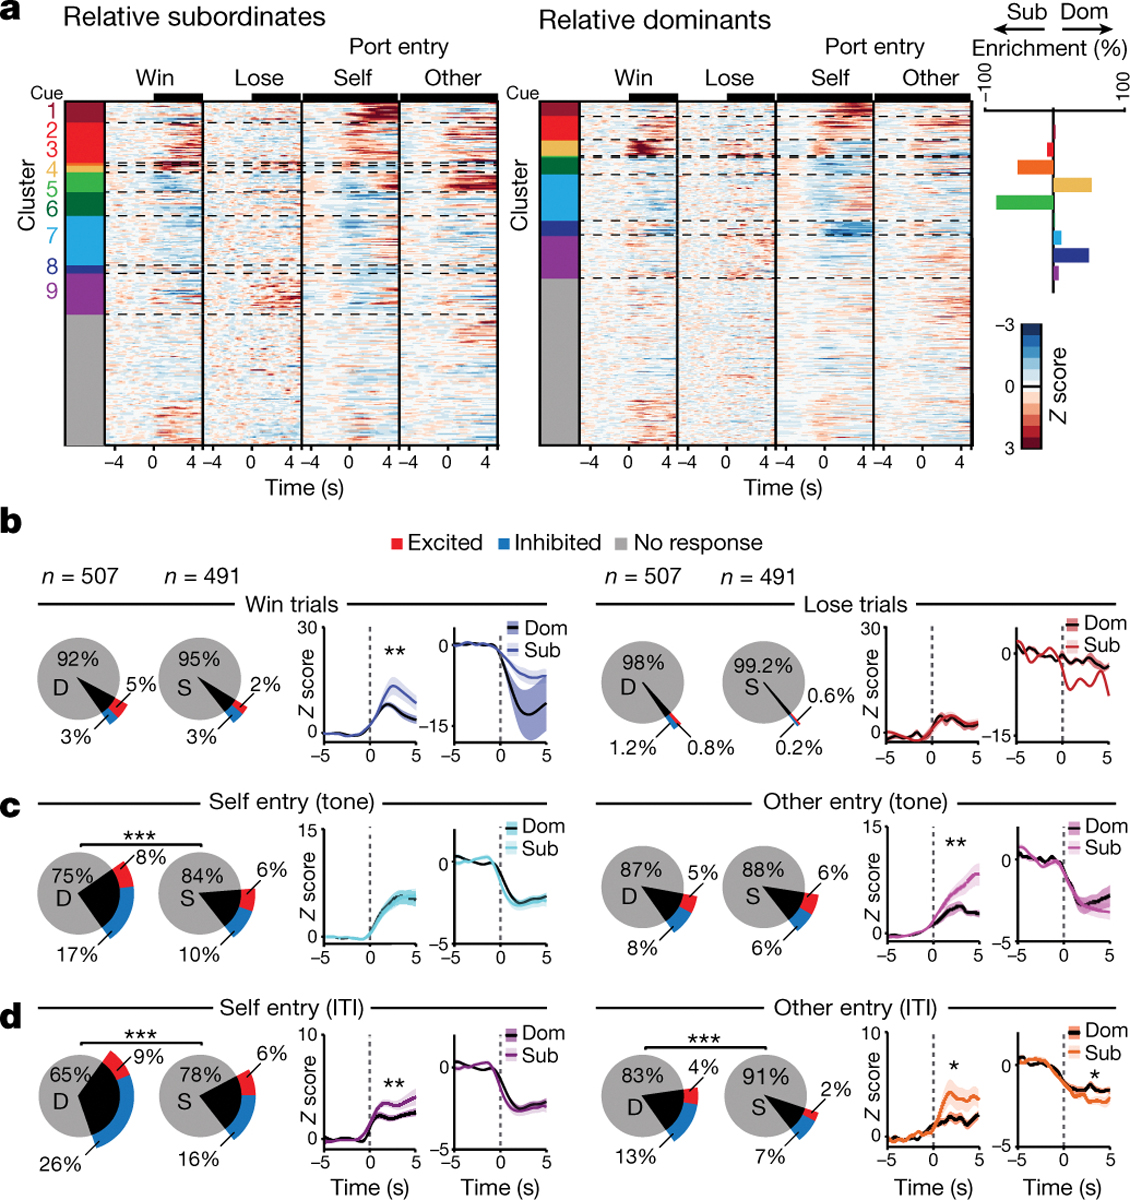
Figure 3: Relative dominants have more reward seeking behavior cells while subordinates have larger responses to competitor behavior.

a, Left, heatmaps for mPFC firing rate responses to task-relevant events during the reward competition. Colors indicate clusters obtained by hierarchical clustering. Cells included in heatmap have a Z-score greater than 2 or less than −1 (Dom n=326; Sub n=306); clusters with a non-responsive population average were labeled gray. Right, difference between relative dominant (Dom) and subordinate (Sub) cells (% enrichment) across functional clusters. b, Left, response magnitude for mPFC cells during win trials differed across relative ranks (dominant D; subordinate S; Fisher’s exact test, total responsive cells per group p=0.30; Wilcoxon rank-sum across groups: excited p=0.01; inhibited p=0.06). Right, number of responsive cells and response magnitude for lose trials did not differ by relative rank (Fisher’s exact test, total responsive per group p=0.17; Wilcoxon rank-sum: excited p=0.62; inhibited p=0.28). c, Left, number of mPFC self tone port entry responsive cells was higher for relative dominants (Fisher’s exact test, total responsive cells per group p=0.0003; Wilcoxon rank-sum: excitation p=0.28 and inhibition p=0.99). Right, there was no difference in number of other tone port entry responsive cells, while the excitation magnitude was higher for relative subordinates (Fisher’s exact test, total responsive cells per group p=0.84; Wilcoxon rank-sum: excitation p=0.006, inhibition p=0.11). d, Left, relative dominants had more mPFC responsive cells to self port entries during the ITI while relative subordinates had larger excitation magnitude (Fisher’s exact test, p=9.8×10⁻⁶; Wilcoxon rank-sum: excitation p=0.006 and inhibition p=0.28). Right, relative dominants had more responsive mPFC cells to other port entries during ITI while subordinates had larger magnitudes (Fisher’s exact test, p=0.00019; Wilcoxon rank-sum: excitation p=0.015 and inhibition p=0.04). Recordings were collected from 20 mice; sample indicated in plots is cells. Data are presented as mean +/− SEM.
