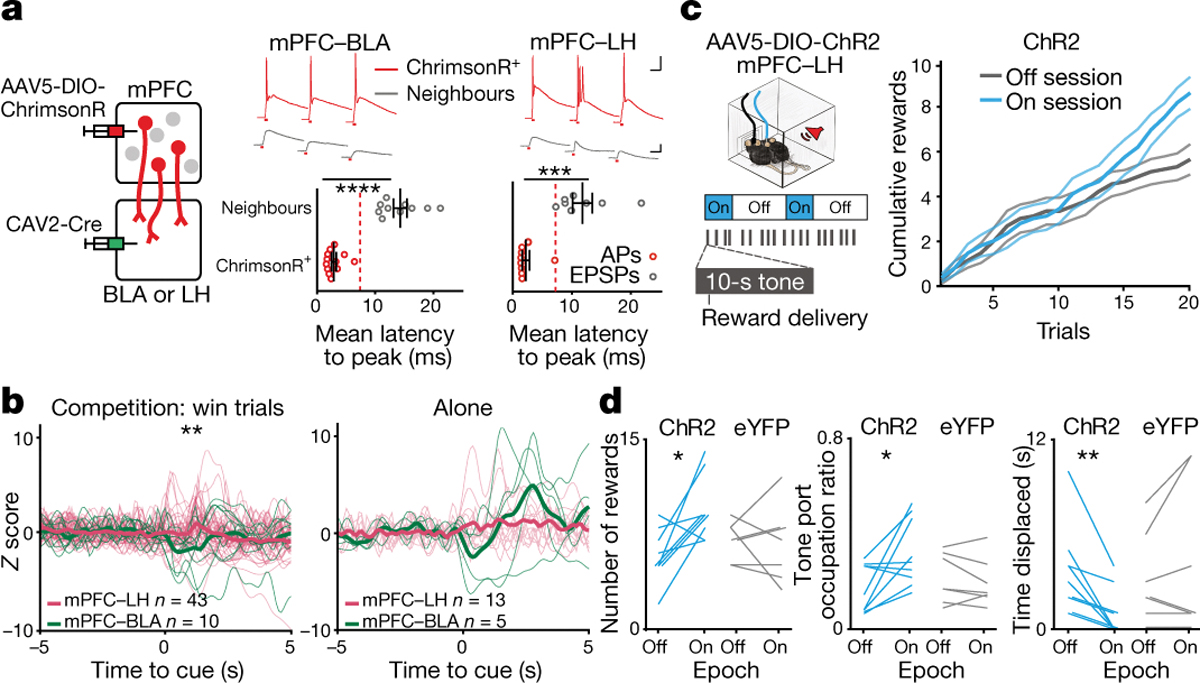
Figure 4: mPFC-LH pathway encodes social competition and modulates social dominance behavior.

a, Left, viral strategy to stimulate projectors. Top, mPFC projector cells (ChrimsonR+; red) and neighbor cells (gray) responding to pulses of red light. Top scale 40 ms and 20 mV, bottom scale 40 ms and 4 mV. Bottom, average photo-latency of action potentials (AP) or excitatory postsynaptic potentials (EPSPs) for mPFC-BLA (left plot) and mPFC-LH (right plot) ChrimsonR+ cells compared to neighboring cells (mPFC-BLA ChrimsonR+ n=12 vs neighbors n=10; t-test, ****p<0.0001; mPFC-LH ChrimsonR+ n=9 vs neighbors n=8; t-test, ****p<0.0001). Dash lines indicate photoresponse latency threshold used for phototagging projector. b, Firing rate of mPFC-LH is higher than mPFC-BLA during the reward delivery (0–2 s) in win trials (mPFC-BLA n=10 neurons, mPFC-LH n=42 neurons, Wilcoxon rank-sum p=0.015). Firing rate for projector populations during tones for the reward task alone (alone data: mPFC-BLA n=5 neurons, mPFC-LH n=13 neurons, Wilcoxon rank-sum p=0.50; alone vs comp mean Z-score during tone; mPFC-LH p= 0.0189, mPFC-BLA p=0.43). Thicker lines represent the mean. c, Left, during reward competition light OFF or light ON sessions in which light was delivered in epochs (5 min light epoch of four 5 ms light pulses at 100 Hz every 200 ms). Right, cumulative rewards obtained by ChR2 mice in the light OFF vs light ON session (n=9 mice). Data are presented as mean values +/− SEM. d, mPFC-LH cell stimulation increased the number of trials won (Left; ChR2 n=9, eYFP n=7; 2-way RM ANOVA interaction of virus and light F(1,14)=5.22, p=0.03; Bonferroni corrected t-test ChR2 p=0.01), time spent occupying the reward port (Middle; ChR2 n=9, eYFP n=7; 2-way RM ANOVA interaction of virus and light F(1, 14)=6.73, p=0.02; Bonferroni corrected t-test, ChR2 p=0.02) and decreased time spent being displaced (Right; ChR2 n=9 paired t-test, p=0.005; eYFP n=7 paired t-test, p=0.28).
