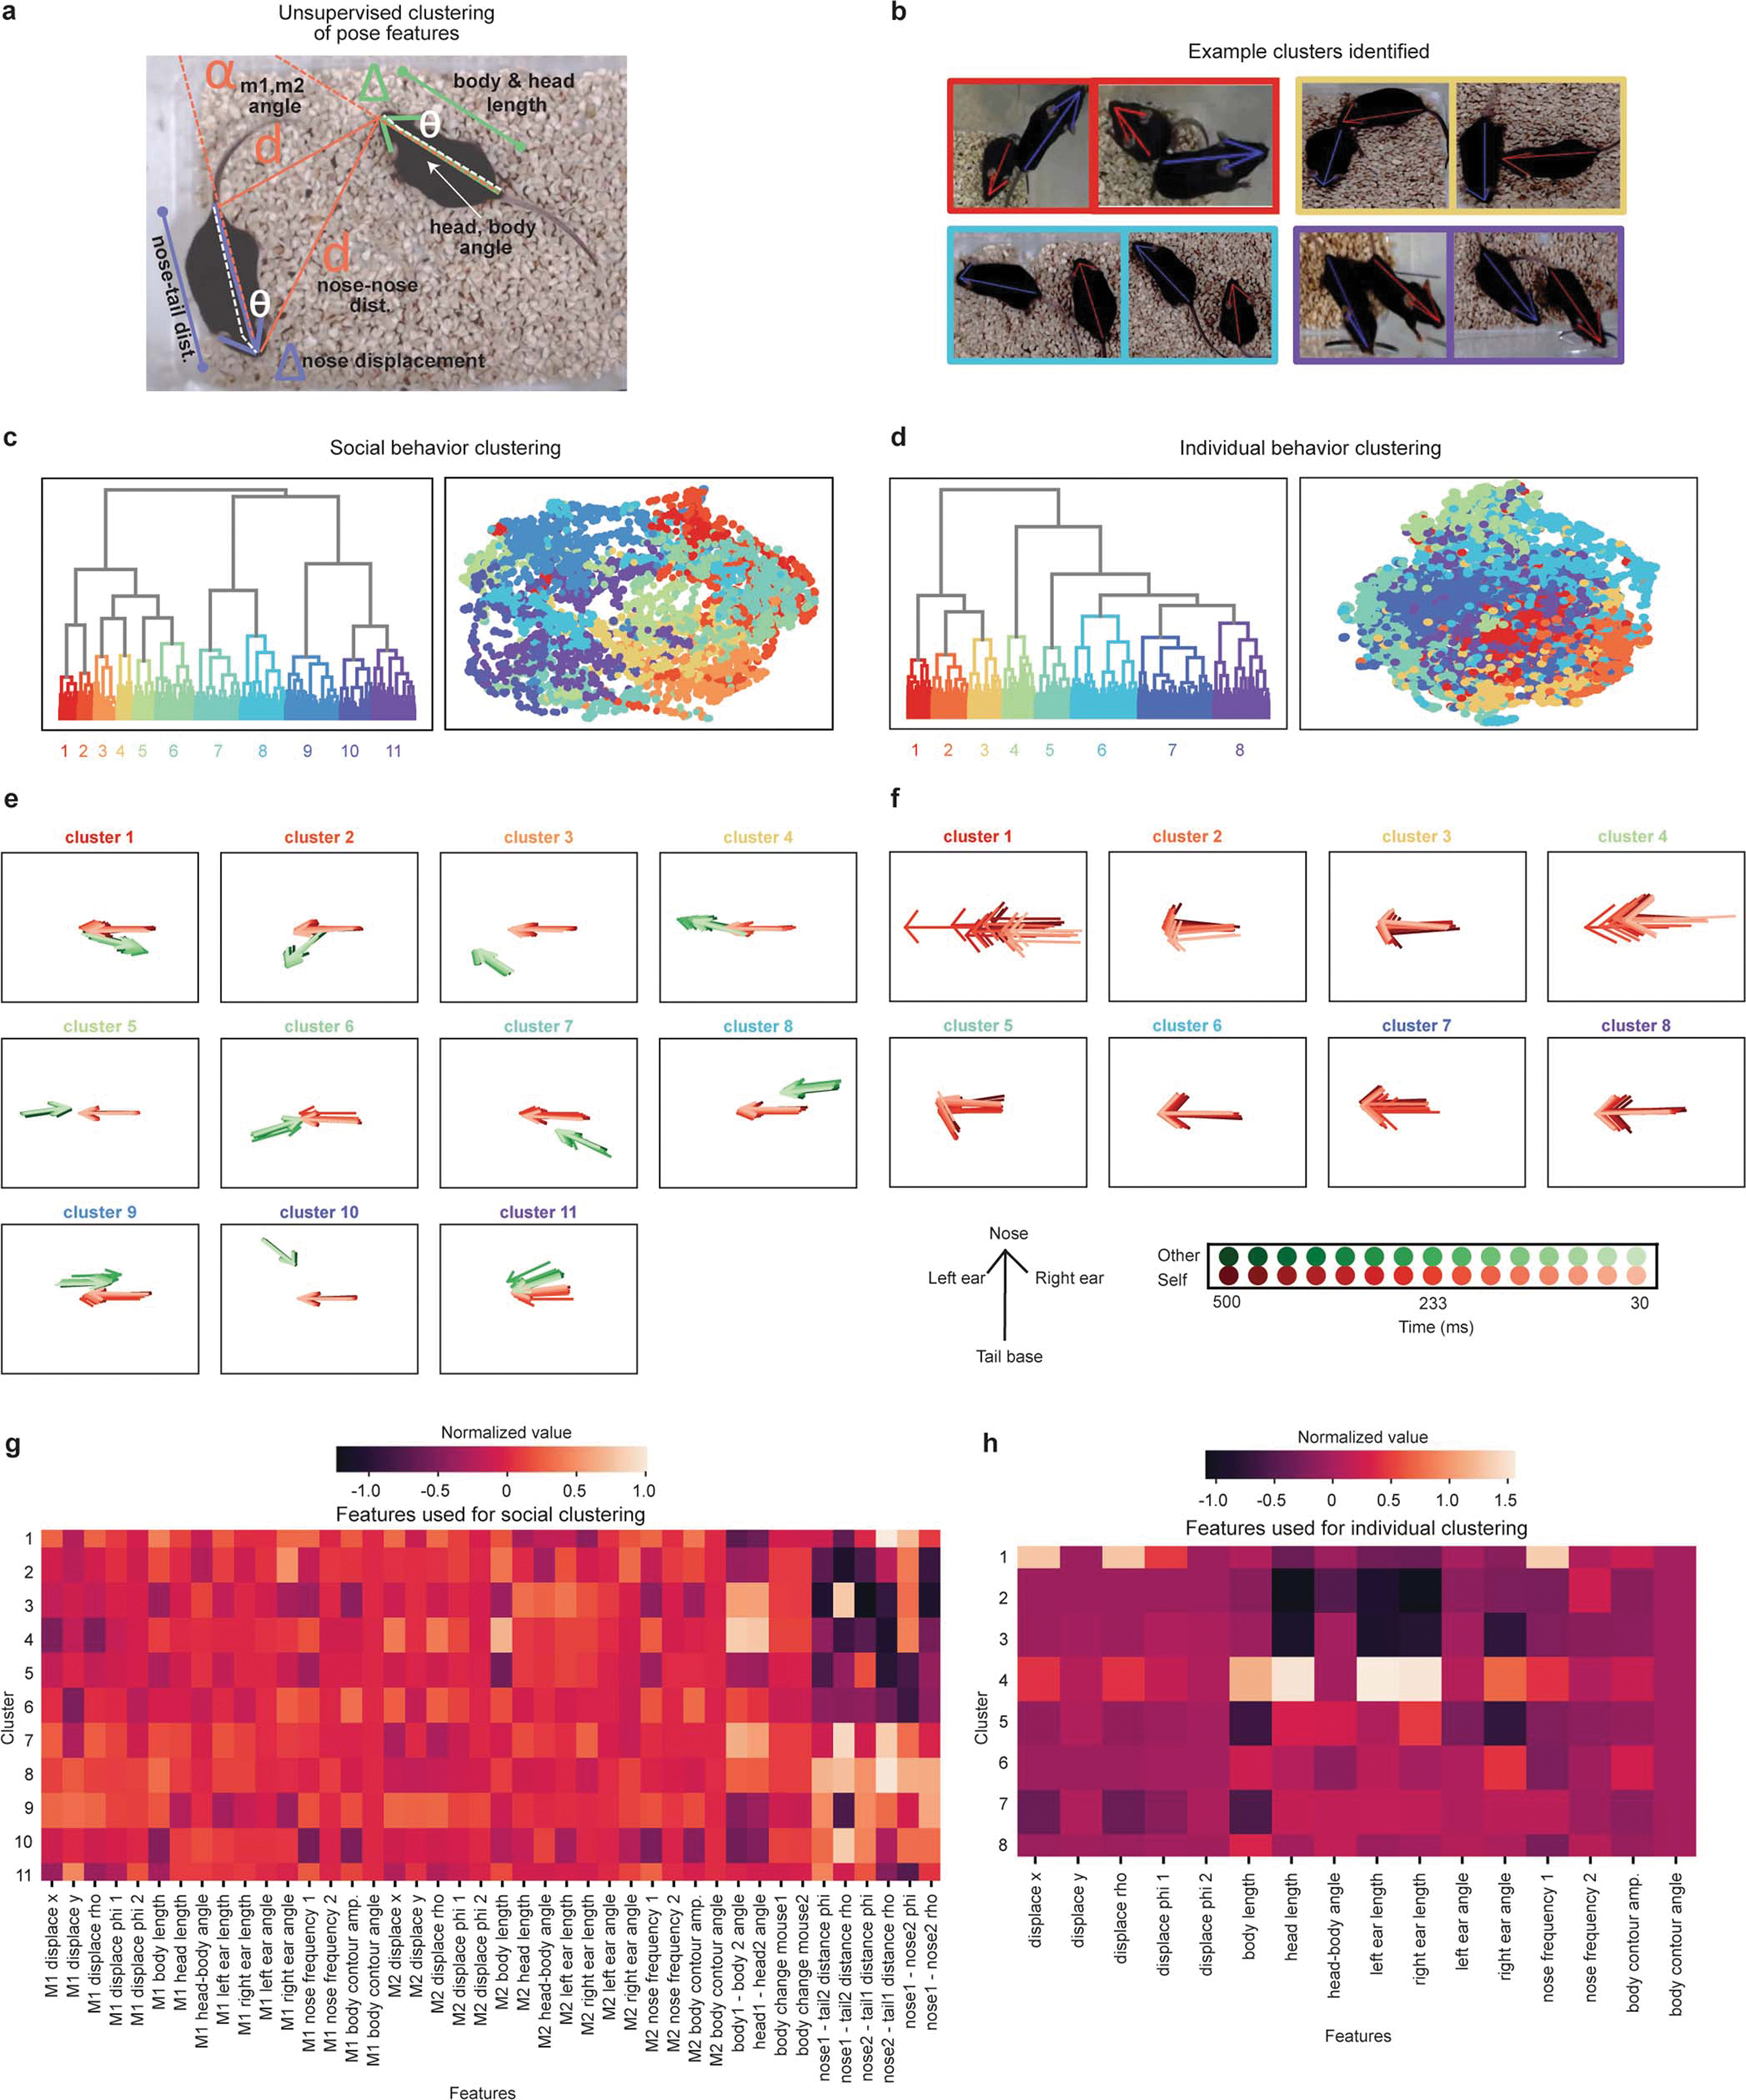
Extended Data Figure 3: AlphaTracker unsupervised clustering results.

a, Diagram depicting features used for AlphaTracker’s unsupervised clustering of the tracking datapoints. The features include head length, body length, body-head angle, displacement of the nose, distance between mice, angle between mice. b, Example frames from clips belonging to a specific cluster (cluster ID indicated with the color outline in c). c, Dendrogram and UMAP plot showing all video clips color coded by cluster ID for social behavior clustering. The mean cluster outputs are shown in (e) and features used are shown in (g). d, Dendrogram and UMAP plot showing all video clips color coded by cluster ID for individual behavior clustering. The mean cluster outputs for this clustering are shown in (f) and features used are shown in (h). e, Average normalized skeleton for nose, ears and tail base across clusters for the social behavior clustering across 500 ms of video clip time. Red arrow indicates self skeleton and green indicates the other skeleton. Each arrow represents 33.3 ms of data (1 frame). f, Average normalized skeleton for nose, ears and tail base across clusters for the individual behavior clustering across 500 ms of video clip time. Each arrow represents 33.3 ms of data (1 frame). Legend in bottom applies to panels e-f. g, Heatmap of normalized values for the self and other features used for social behavior clustering. h, Heatmap of normalized values for the self features used for individual behavior clustering.
