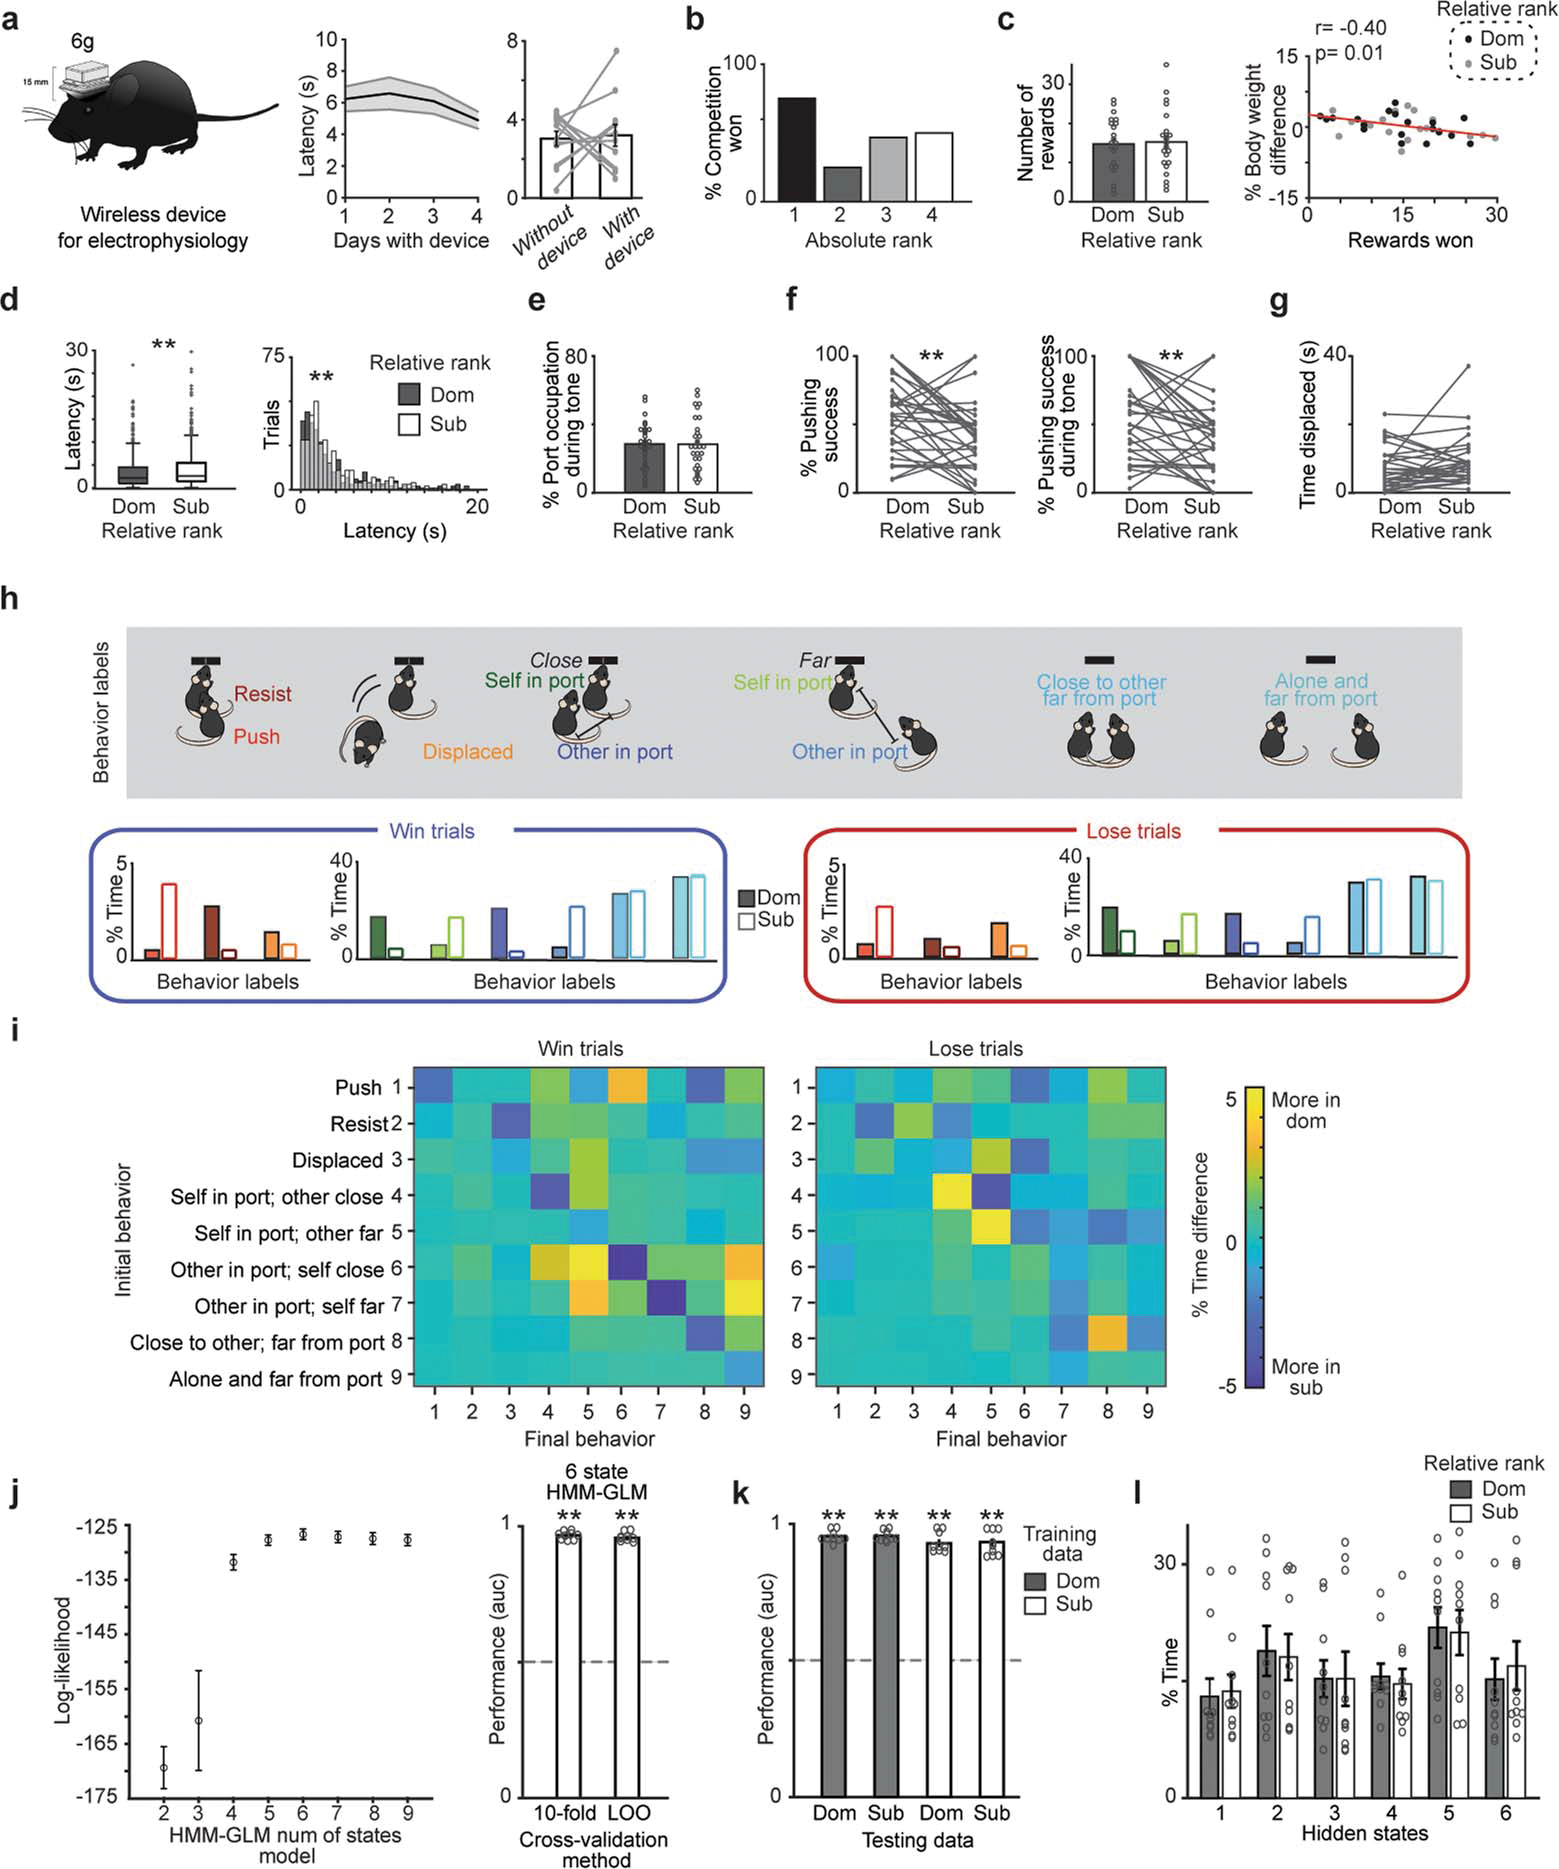
Extended Data Figure 5: Behavior in competition with logger and HMM-GLM model controls.

a, Left, diagram of wireless electrophysiology recording device used for mPFC recordings. Image modified from SpikeGadgets’ MiniLogger product illustration. Middle, latency to collect reward over four days of training (n=16 mice). Right, latency to collect reward while performing reward task alone was not affected by wearing the logger (n=12 mice; paired t-test, p=0.83). b, Percent competitions won by absolute rank is highest for rank 1 mice in dataset used for mPFC recordings (number of competitions per rank 1 n=12; rank 2 n=12; rank 3 n=15; rank 4 n=14). c, Left, number of rewards obtained by relative dominants (dom) and subordinates (sub) during the reward competitions between animals wearing loggers (n=22 mice per group; paired t-test, p=0.86). Right, % body weight difference between competitors significantly correlates with rewards won (sub n=19 dom n=20, Pearson’s correlation, *p=0.01). For correlation only mice with same day weight measurements were used. d, Subordinates had longer latencies to pick up the reward during win trials (center line, median; box limits, upper and lower quartiles; whiskers, 1.5x interquartile range; points, outliers). Left, latency per group. Right, histogram of the distribution of latencies across all trials (dom trials n=326, sub trials n=358, Wilcoxon rank-sum, p=0.012; Two-sample Kolmogorov-Smirnov test, dom vs sub trials p=0.015; One way RM-ANOVA F(1,24)=2.06, p=0.002). e, Percent port occupancy during tone across relative rank (n=31 sessions, paired t-test p=.90). f, Relative dominants were more successful displacing subordinates from the reward port throughout the competition (left; n=32 sessions, paired t-test, p=0.002) and during the tone time (right; n=31 sessions, paired t-test, p=0.005). g, Total time being displaced from reward port by relative rank in dataset used for mPFC recordings (n=31 sessions; paired t-test p=0.15). h, Percent time (normalized by total time per behavior) for 9 behaviors analyzed for win and lose trials separated by relative social rank. i, Percent time difference between relative dominant and subordinates for behavioral transitions during win trials (left) vs lose trials (right). j, Left, model selection for HMM-GLM state number using 10-fold cross-validation method results in a 6 state model being optimal. Error bars indicate standard error across the 10 cross-validations. Right, HMM-GLM 6 state model performance predicts behavioral label regardless of training method utilized (AUC n=9, one per each behavior label; Sign test of model performance vs chance p=0.004 for both methods). k, HMM-GLM 6 state model predicted behavioral label regardless of which dataset was used for training or testing (n=9 behavior labels using 482 trials for dom vs 478 trials for sub; Sign test performance vs 0.5 (chance) p=0.004 for all tests). l, Distribution of percent time spent in each hidden state by relative rank group (n=10 cross-validations using 482 trials for dom vs 478 trials for sub from 14 mice).
