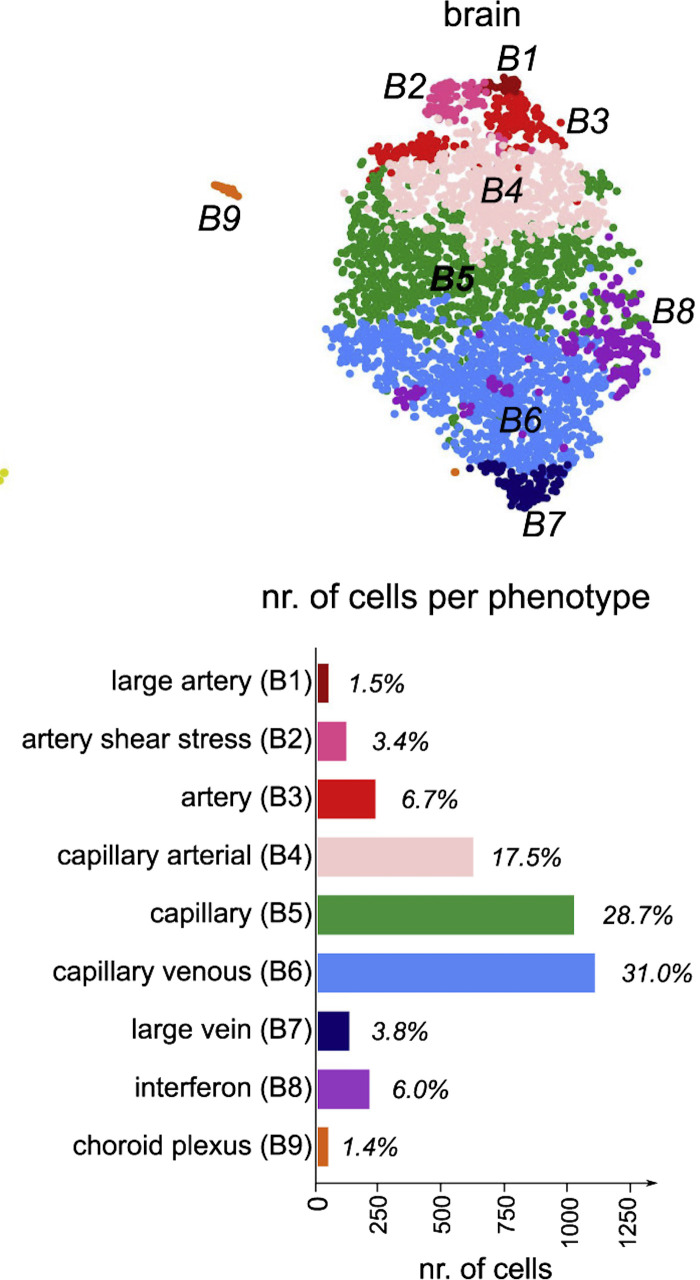
Figure 2.
Endothelial cell subclusters detected by single-cell transcriptomics identify endothelial cells unique to the brain such as choroid plexus capillary endothelial cells and interferon-activated endothelial cells along with heterogeneous endothelial cells distributed along the vascular segments. T-Distributed stochastic neighbor embedding (t-SNE) plot visualization of brain tissue-specific endothelial cell clusters with distinct color codes are shown on top. Bar graph depiction of number of cells and the relative fraction of each subcluster is shown below. Modified from Ref. 9.

