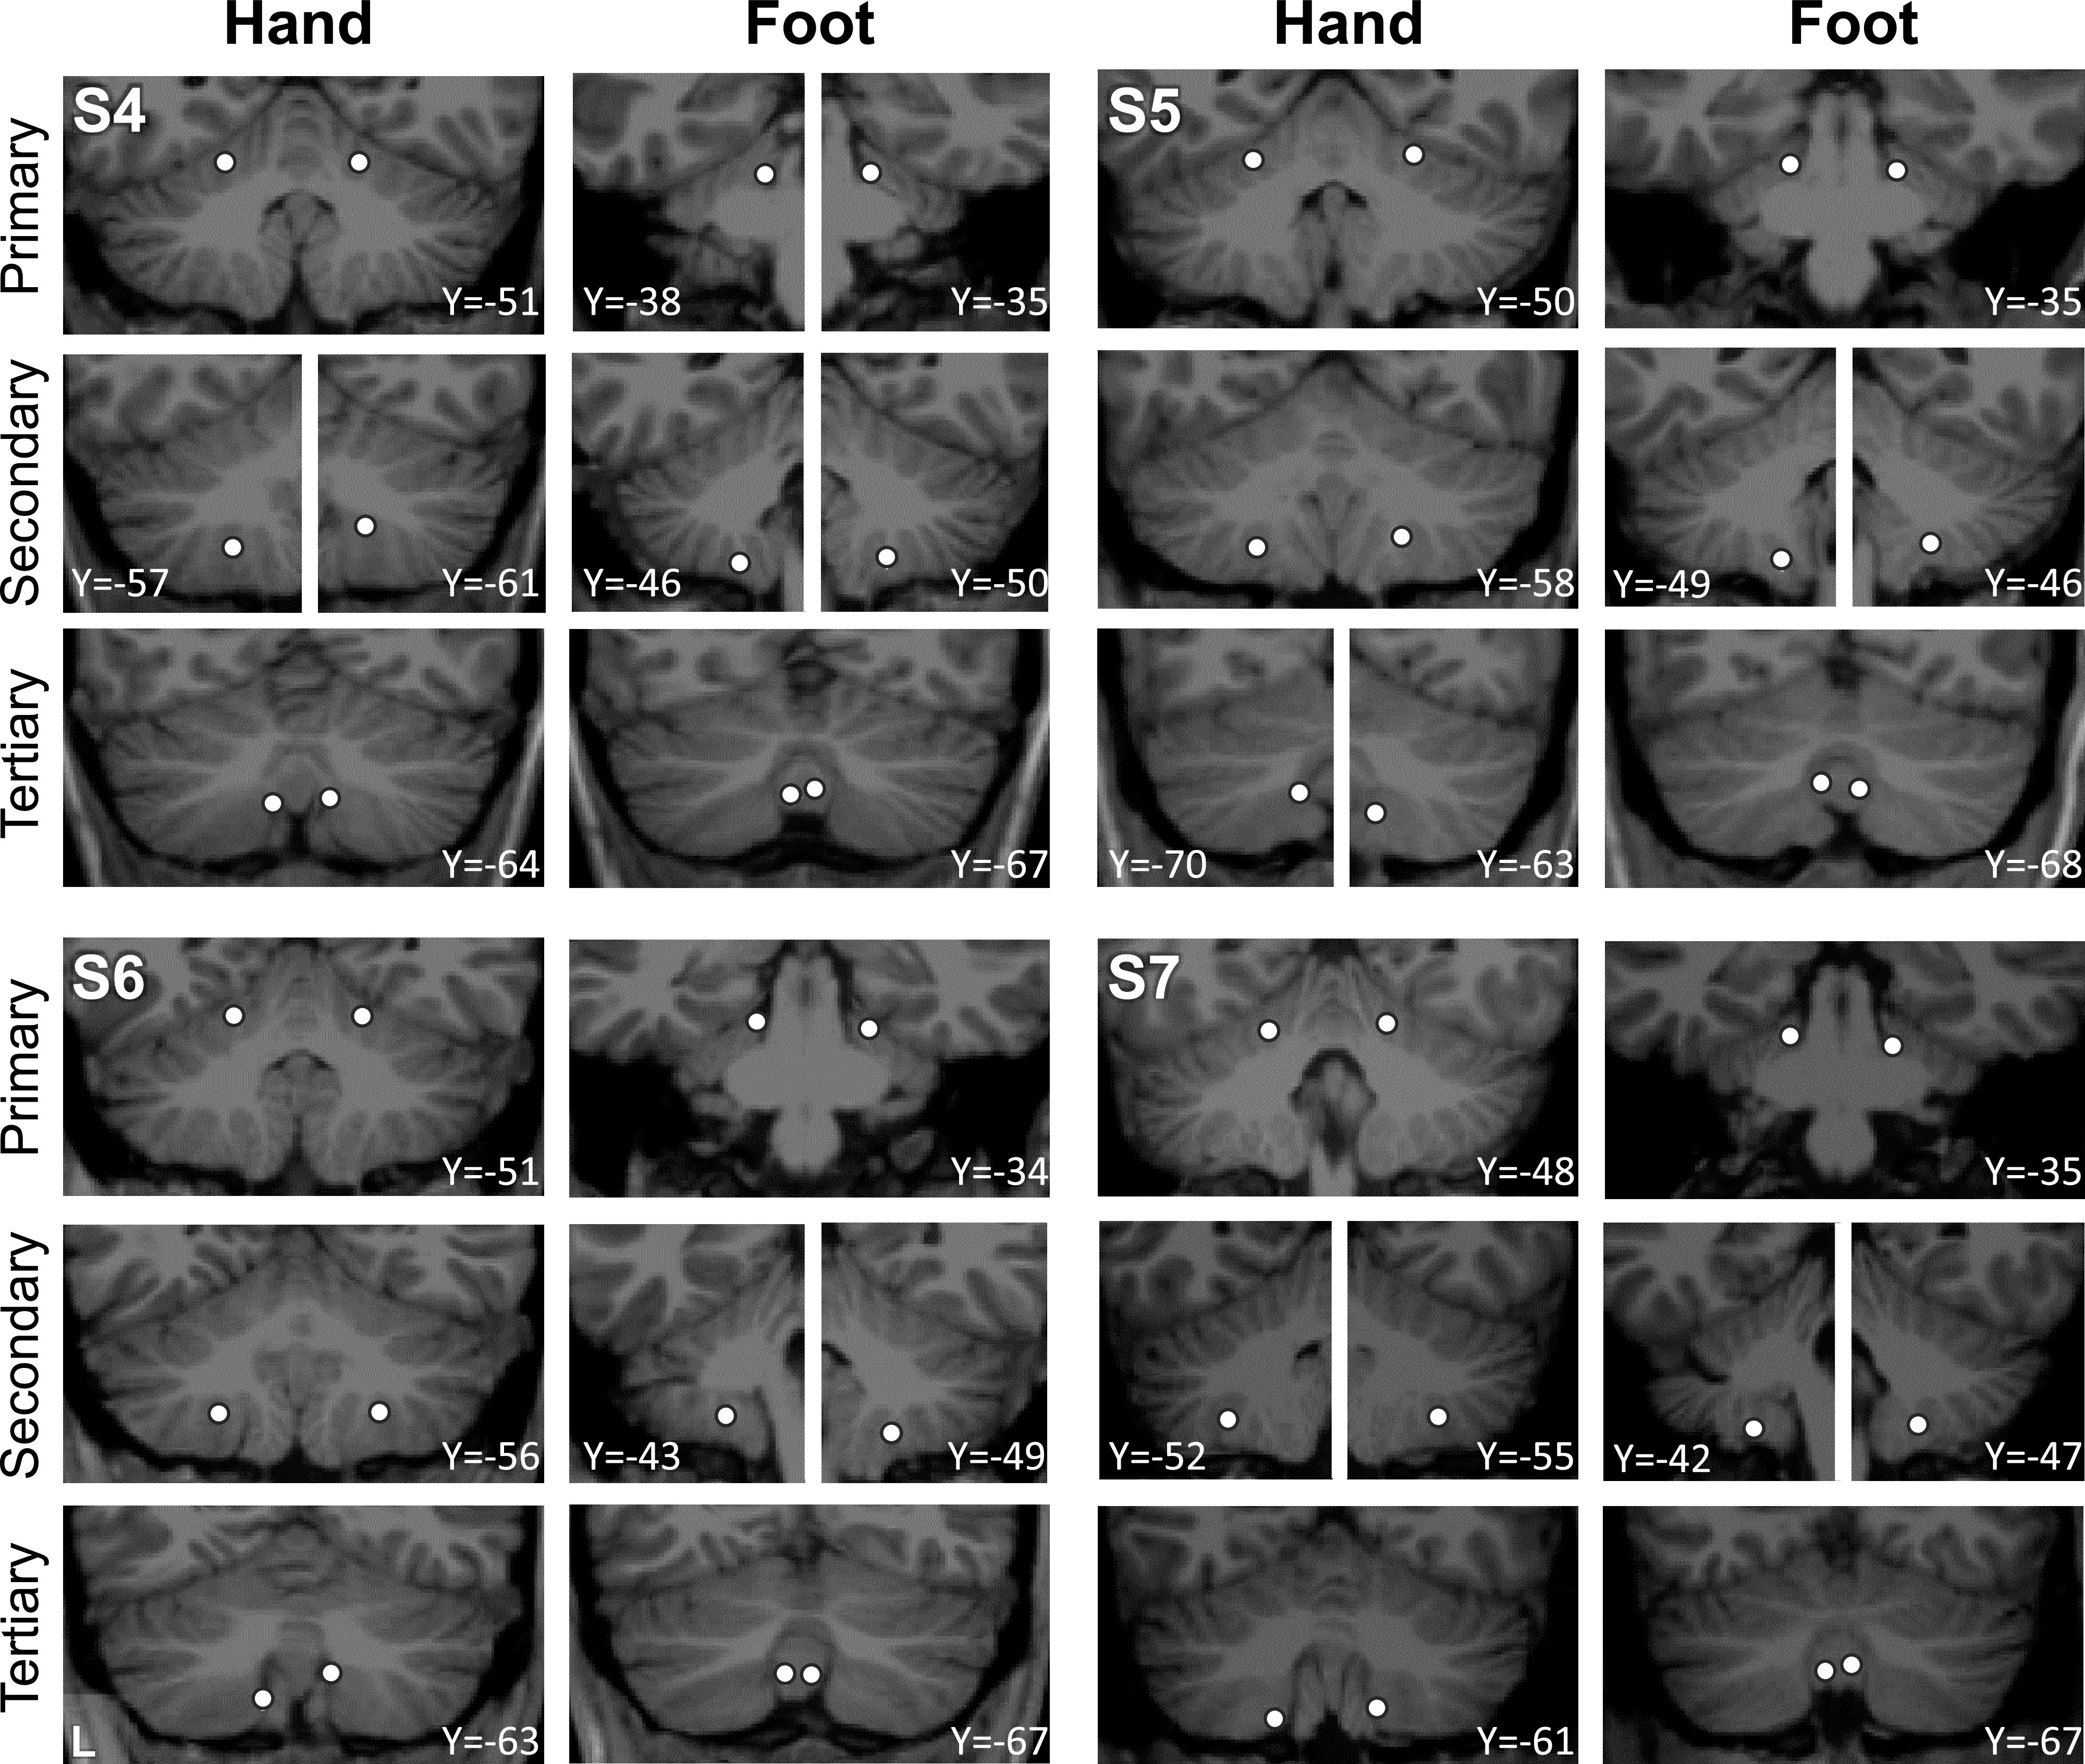
Figure 14.

Visualization of seed region locations in the volume for S5 to S8. Seed region locations of the right and left primary, secondary, and tertiary representations (white circles) are plotted on coronal sections of the T1 structural image for each participant in the Replication sample. Sections presented are of the seed region’s center or within 1 mm of the center. For each individual, hand and foot seed region locations are presented. Note how the tertiary foot location is medial to the hand representation in each participant. Coordinates indicate the section level in the space of the MNI152 atlas. L indicates left.
