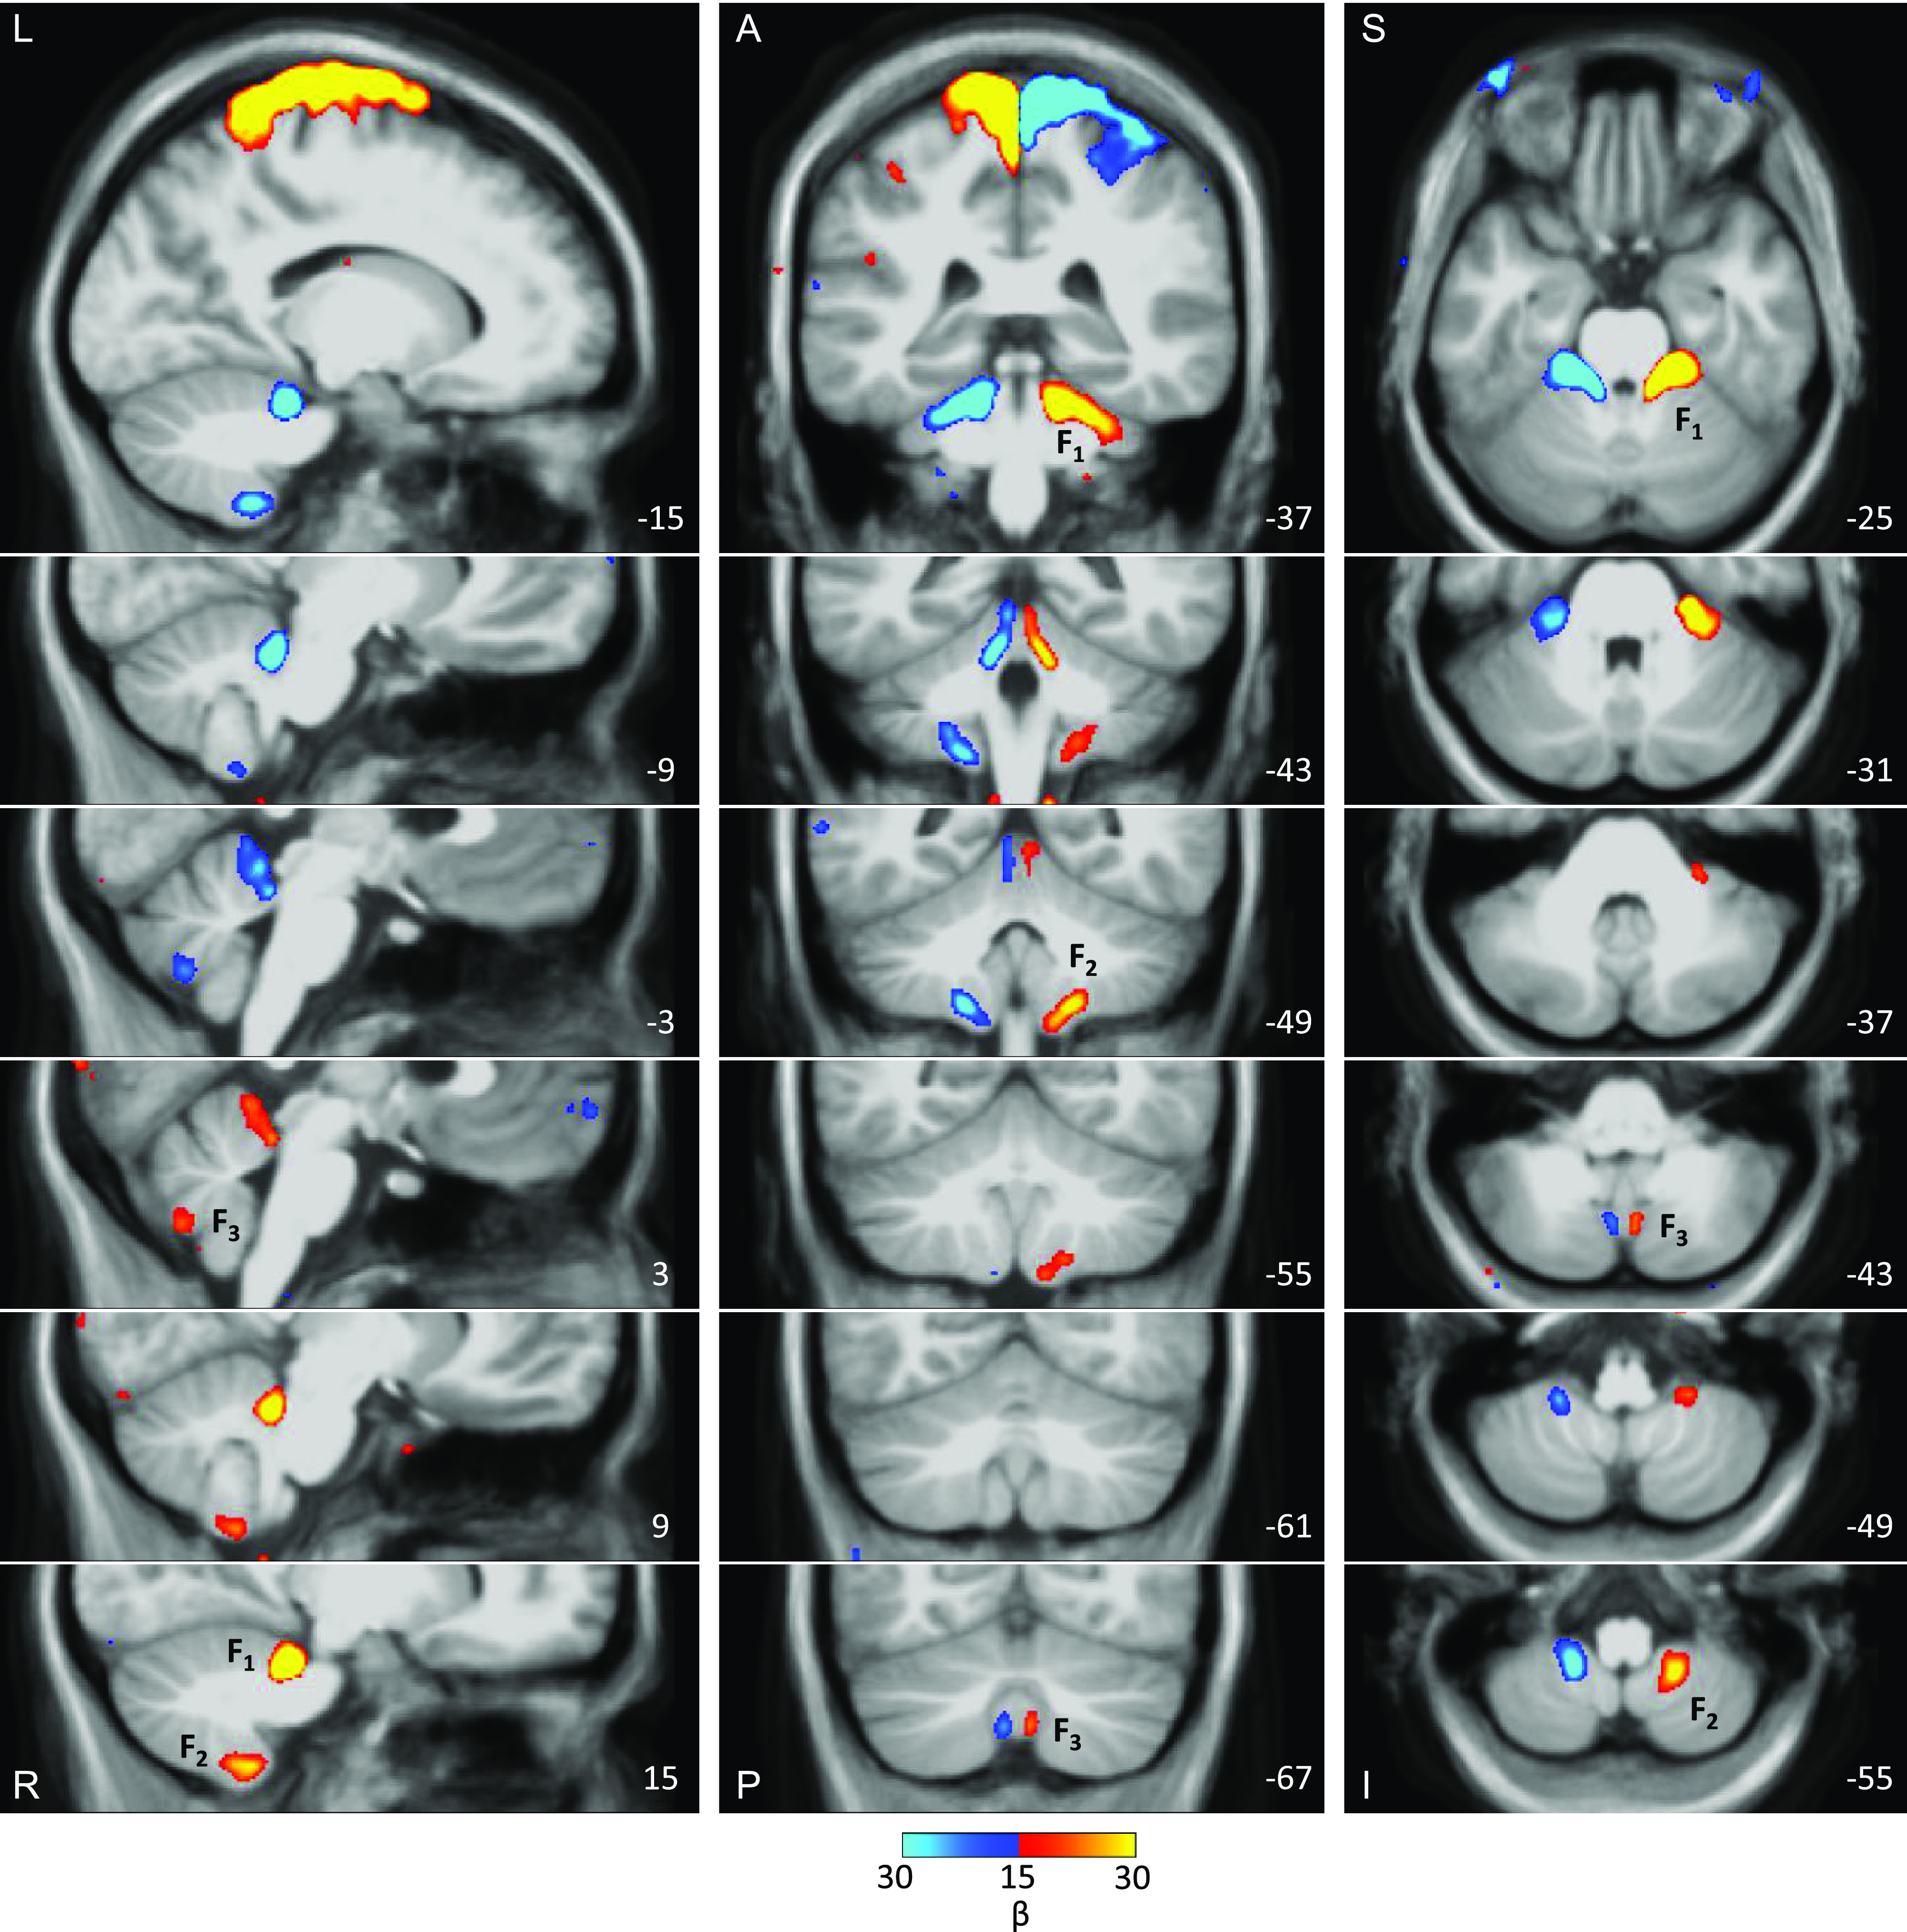
Figure 16.

The three somatomotor representations of the foot are anatomically distinct in the group-averaged map, overlaid on the volume of the cerebellum. The three columns display sections in sagittal (left), coronal (middle), and transverse (right) orientation. In each orientation, the third foot representation is detected and anatomically separated from the second foot representation. The right primary, secondary, and tertiary representations are marked by F1, F2, F3. Note that the third representation is smaller in size as compared with the other two representations. The anatomical backdrop is the average volume from the eight participants contributing to the functional data. In the middle and right columns, left is displayed on the left. Coordinates at the bottom right of each panel indicate the section level in the space of the MNI152 atlas. The color bar represents the mean β values. A, anterior; I, inferior; L, left; P, posterior; R, right; S, superior.
