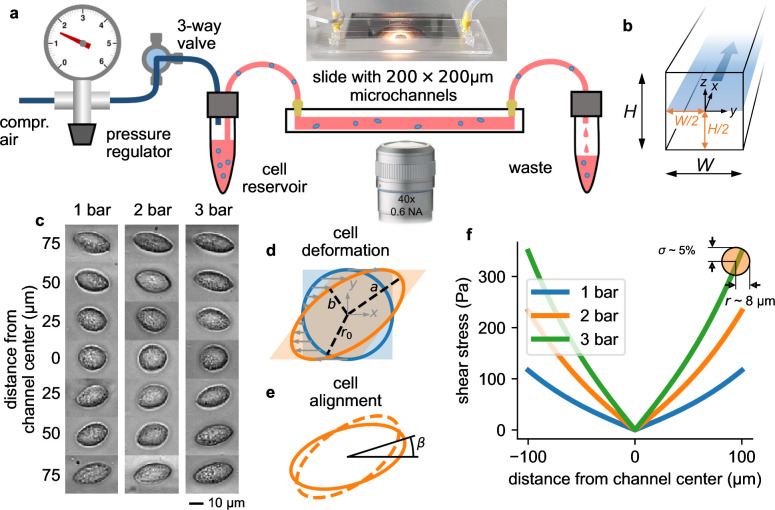
Figure 1. Measurement setup and principle.
a, Schematic of the microfluidic device. b, Cross section through the microchannel with dimensions = = 200 µm. The focal plane of the microscope at a height of /2=100 µm is indicated by the blue shaded area. Fluid flow is in direction. c, Bright field images of NIH-3T3 cells under control conditions at different y-positions in a microchannel at a pressure of 1, 2, and 3 bar. Cells appear round in the channel center and become more elongated near the walls. d, Illustration of cell deformations under fluid shear. The circular cell with radius r0 (blue) is transformed to an elliptical shape (orange) with semi-major axis and semi-minor axis depending on the ratio of fluid shear stress and the cell’s shear modulus (Equation 16). e, The sheared cell (dashed outline) will partially align in flow direction (solid outline), characterized by an alignment angle β. This angle depends on the ratio of cell viscosity and suspension fluid viscosity (Equation 17). , , and β are measured from the segmented cell shapes. f, Fluid shear stress (computed according to Equation 4) versus distance from the channel center in -direction for three different pressures of 1, 2, and 3 bar. Close to the channel wall, the shear stress varies by 5% across the cell surface for a typical cell with a radius of 8 µm (indicated by the orange circle). Cells that extend beyond the channel center are excluded form further analysis.


