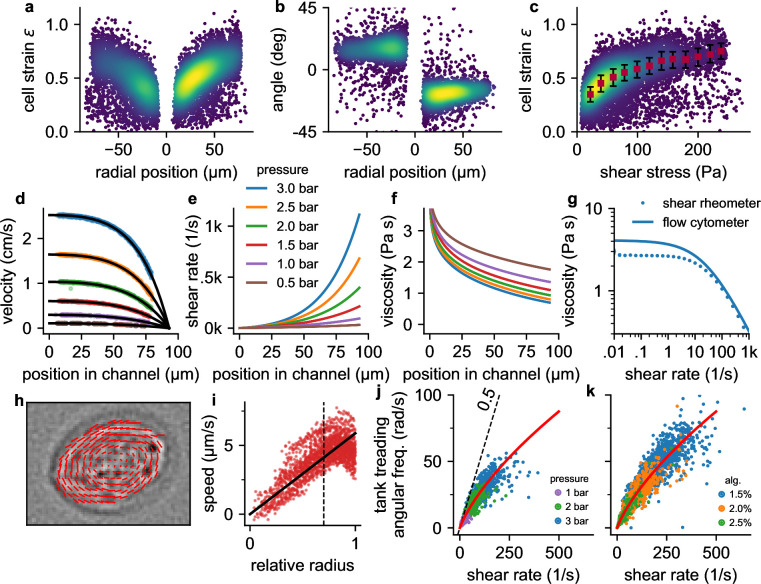
Figure 2. Cell responses to shear stress and shear rate.
a, Cell strain versus radial () position in the channel for NIH-3T3 cells at a pressure of 3 bar. Each data point corresponds to a single cell. Colors indicate Gaussian kernel density. b, Cell alignment angle β versus radial position in the channel () for the same cells as in a. c, Cell strain versus shear stress for the same cells as in a. Red squares indicate median values over shear stress bins of 20 Pa starting from 10 Pa, error bars indicate quartiles. d, Fluid flow velocity versus radial channel position () for different driving pressures (0.5, 1.0, 1.5, 2.0, 2.5, 3.0 bar). Each data point corresponds to the speed of a single cell. Black lines show individual fit curves obtained by fitting the Cross-model (power-law shear thinning fluid with zero-stress viscosity) to the velocity profile (Equation 5 - Equation 9). e, Shear rate of the suspension fluid versus radial channel position () for different driving pressures. The shear rate is computed with Equation 7. f, Local suspension fluid viscosity at different channel positions computed with Equation 6. g, Suspension fluid viscosity versus shear rate from the fit of the Cross-model (blue line) to the data shown in d, and measured with a cone-plate rheometer (blue circles). h, Tank-treading rotation of a cell in the channel, quantified from the optical flow between two subsequent images. i, Rotational speed of cell image pixels (same cell as in h) versus the ellipse-corrected radius (radial pixel position normalized by the radius of the cell ellipse at that angle). Only cell pixels with an ellipse-corrected radius below 0.7 (dotted line) are used for the linear fit of the tank-treading frequency to the data (solid line) to avoid cell boundary artefacts. j, The angular tank-treading frequency increases with the shear rate, with a slope approaching 0.5 for small shear rates (dashed black line). Each point represents the data of an individual cell; different colors indicate different pressures. The red line presents the fit of Equation 20 to the data. k, same as in j but for measurements at a pressure of 2 bar in differently concentrated alginate hydrogels.
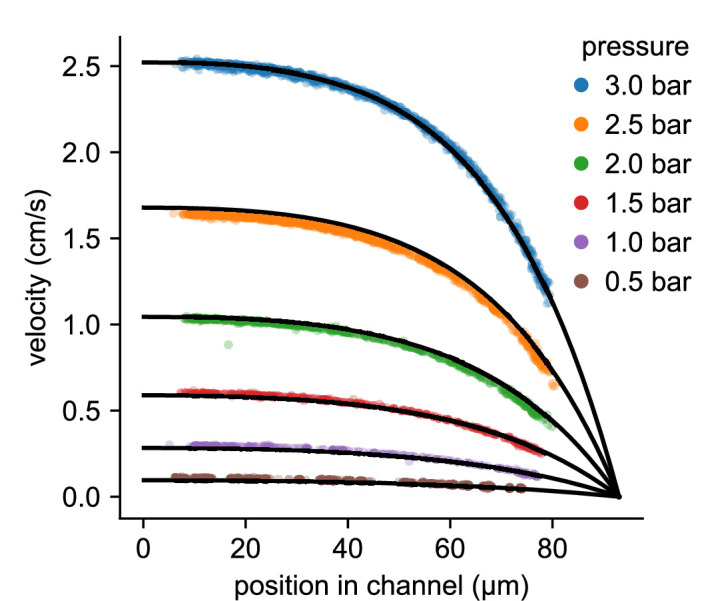
Figure 2—figure supplement 1. Velocity profile of a 2% alginate solution as a function of the -position in the channel for different driving pressures (same data as in Figure 2d).

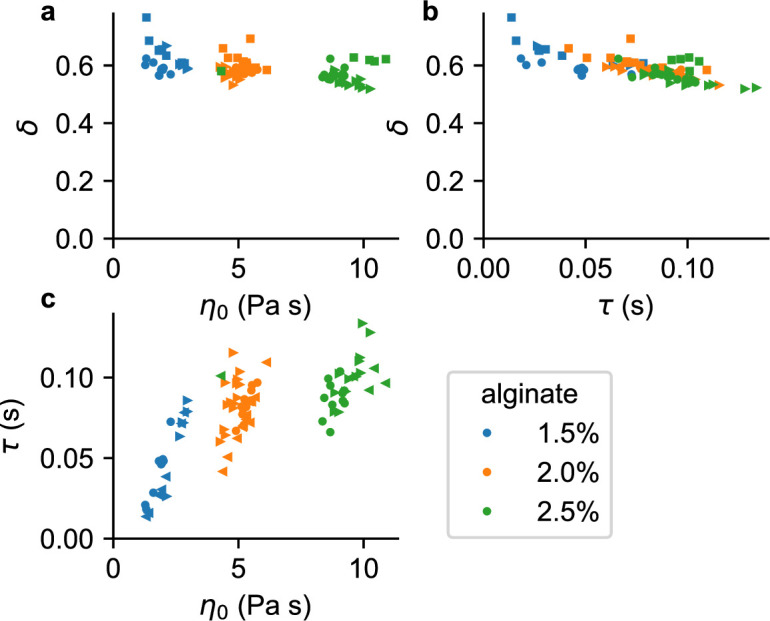
Figure 2—figure supplement 2. Parameters describing the shear-thinning behavior of the suspension fluid for different alginate concentrations (1.5%, 2.0%, 2.5%).


