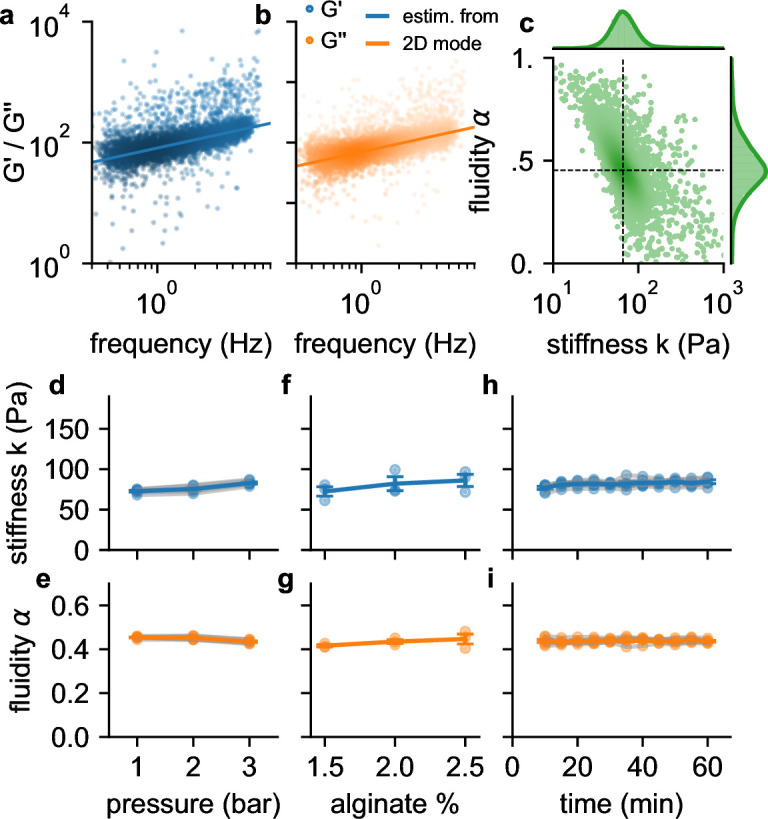
Figure 3. Frequency, pressure, suspension fluid, and time dependency of viscoelastic cell behavior.
a, (blue dots) b and (orange dots) of individual NIH-3T3 cells measured at 300 kPa. Lines are not a fit to the data but indicate the predicted behavior of (blue line) and (orange line) versus angular (tank-treading) frequency according to Equation 1 of a typical cell with stiffness and fluidity corresponding to the mode of the 2D histogram shown in c (the mode is indicated by the intersection of the dashed lines). c, Distribution of stiffness and fluidity α of the same cells as shown in a,b, dashed lines indicate the mode of the 2D histogram. Color coding shows 2D Gaussian kernel density estimation. Histograms show the probability density distributions of (top) and α (side) with Gaussian kernel density estimates (green shading). d, Stiffness of NIH-3T3 cells increases with pressure (blue lines and symbols indicate mean ± se, gray lines and transparent symbols indicate individual data from 6 independent measurements). e, Fluidity α (same cells as in d) remains constant for all measured pressures. f,g, Stiffness and fluidity show only a weak dependence on alginate concentration (measured at a pressure of 200 kPa, mean ± se (blue) from 3 independent measurements (gray)). h,i, and α of NIH-3T3 cells remain constant for at least 60 min after suspending them in a 2% alginate solution (measured at a pressure of 300 kPa, mean ± se (blue) from 5 independent measurements (gray)).

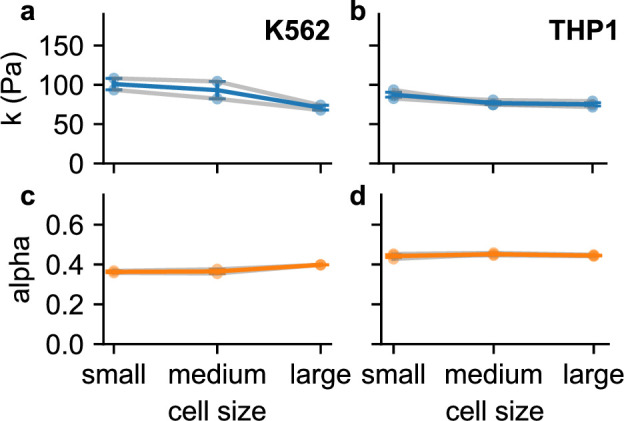
Figure 3—figure supplement 1. Stiffness and fluidity α of K562 cells (2 independent measurements, measured at a pressure of 3 bar) and THP1 cells (3 measurements, 2 bar) for different cell sizes.

