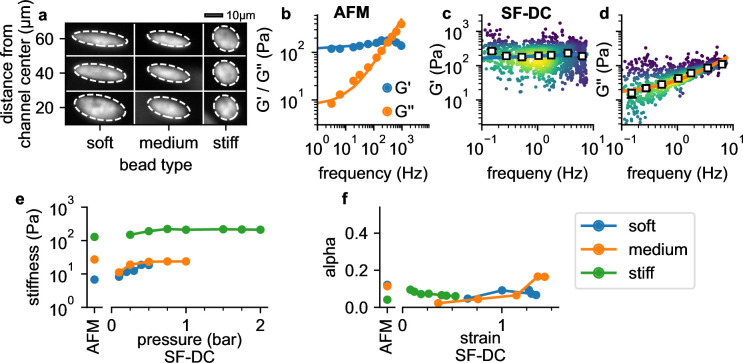
Figure 4. Validation with polyacrylamide beads.
(a) Deformation of PAAm beads with different acralymide-bisacrylamide total monomer concentrations (soft 3.9%, medium 5.9%, stiff 6.9%) at different positions in the channel. (b) AFM data (G' and G" versus frequency, mean values from 14 stiff PAAm beads (blue/orange circles), solid lines are the fit of Equation 2 to the data). G’ (c) and G” (d) for stiff beads at 2 bar. White squares indicate binned median values, blue and orange solid lines are the fit of Equation 2 to the data. (e) AFM-measured stiffness compared to the stiffness versus pressure measured with shear flow deformation cytometry (SF-DC) for differently stiff PAAm beads. (f) AFM-measured fluidity compared to fluidity versus strain measured with SF-DC for the same beads as in e.


