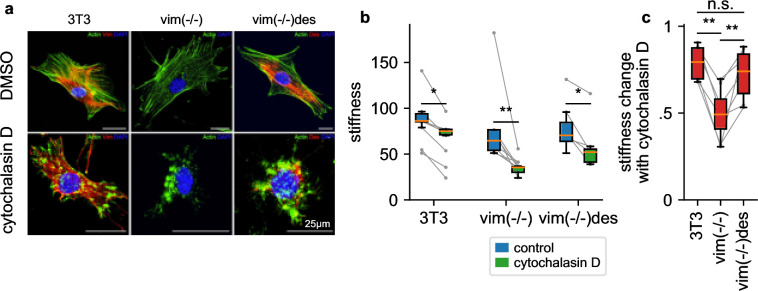
Figure 7. Influence of intermediate filaments.
a, NIH-3T3 MEFs, vimentin-knockout, and desmin-knockin MEFs in DMSO control conditions (upper row) and with cytochalasin D treatment (lower row). Actin (stained with phalloidin-Atto-488) is shown in green, desmin (stained with a rabbit-anti-desmin-CT1 antibody) in red, and the nucleus (stained with DAPI) in blue. b, Stiffness of DMSO control (blue box) and cytochalasin D treated cells (green box) (orange line: median, box: 25 and 75 percentile, whiskers: 5 and 95 percentile, gray points and lines connect mean values from independent measurements performed on the same day, with 1813 cells on average contributing to each data point). c, Stiffness change after treatment with cytochalasin D relative to DMSO control. (statistical significance: * p < 0.05, ** p < 0.01, two-sided Mann-Whitney-U test).

