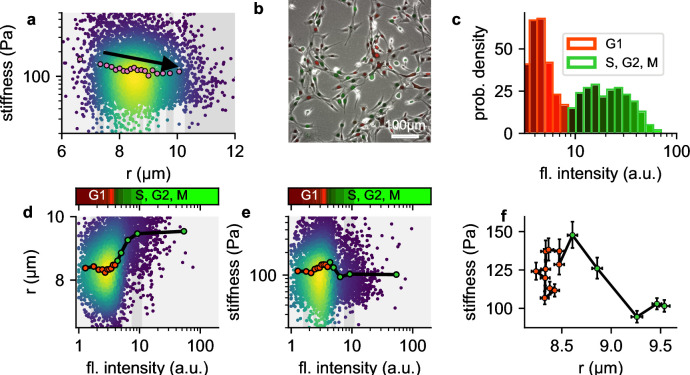
Figure 8. Influence of cell cycle.
a, Cell stiffness versus cell radius, each point corresponds to data from one cell, colors represent Gaussian kernel density, pink circles show median values over bins with equal cell count. Cell stiffness tends to decrease with increasing cell radius. b, Phase contrast and fluorescent image of Fucci-cell cycle indicator-transfected NIH-3T3 cells. Cells in G1 phase show low green and high red fluorescence intensities, cells in S, G2, or M phase show high green and low red fluorescence intensities. c, Histogram of green fluorescence intensities of Fucci-cell transfected NIH-3T3 cells. Bar colors reflect the RGB-colormap of the red and green channel intensities averaged over all cells within a bin. Accordingly, the cell cycle can be deduced from the green intensity alone. d, Cell radius versus green fluorescent intensity. Each point corresponds to data from one cell, colors represent Gaussian kernel density, circles show median values over bins containing an equal number (∼100) of cells. Colorbar represents the RGB-colormap of the red and green intensities of the cells before harvesting, mapped onto the green fluorescent intensity after harvesting measured in the shear flow cytometer. Cell radius increases after cells exit G1 phase. e, Cell stiffness versus green fluorescent intensity. Cells stiffness increases during G1 phase and decreases after entering S phase. f, Cell stiffness versus cell radius; data points correspond the the median values in d and e, red color designates cells in G1 phase, green color designates cells in S, G2 or early M phase. During G phase, cells increase their stiffness while maintaining their radius. After entering S phase, cells increase their radius while their stiffness decreases.

