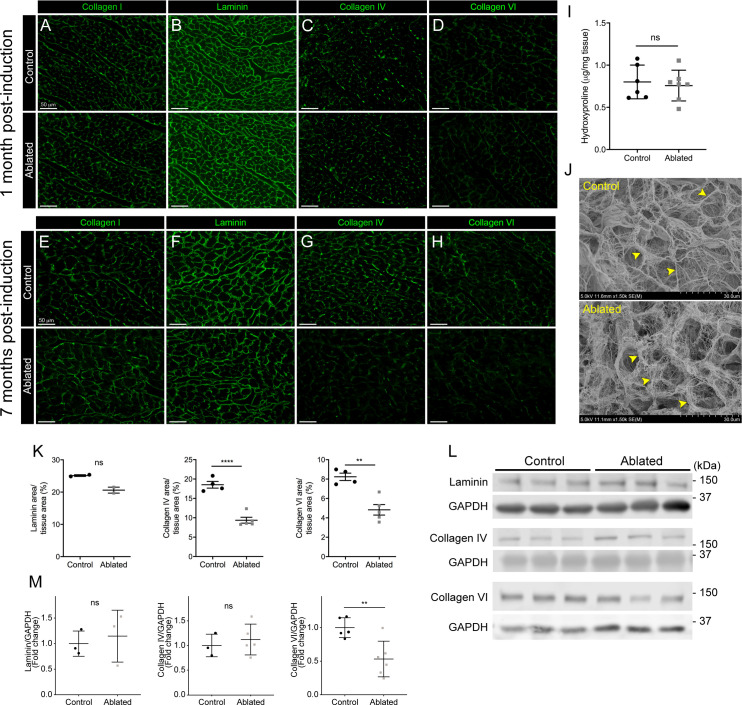
Figure 2. Collagen distribution and basement membrane alterations following fibroblast ablation.
(A–H) Representative images of (A, E) collagen I, (B, F) laminin, (C, G) collagen IV, and (D, H) collagen VI immunostaining at indicated post-induction time points. A representative from a minimum of three biological replicates for each staining. (I) Hydroxyproline content from whole ventricle tissue 5 months after induction. Control: n=6; ablated: n=7. (J) Representative scanning electron microscopy (SEM) images of decellularized left ventricular (LV) tissue at 2 months post-induction. Arrowheads indicate collagen fibrils. Control: n=3; ablated: n=3. (K) Area of laminin (control: n=2; ablated: n=2), collagen IV (control: n=4; ablated: n=5), and collagen VI (control: n=4; ablated: n=5) staining normalized to tissue area 7 months after induction. (L–M) Western blot analysis of whole ventricle lysate 7 months after induction for laminin (control: n=3; ablated: n=3), collagen IV (control: n=3; ablated: n=5), and collagen VI (control: n=5; ablated: n=6). Results are mean ± SD. Statistical significance was determined by an unpaired t-test or a Mann-Whitney U test. ns: not significant, p>0.05; *p≤0.05; **p≤0.01; ****p≤0.0001.

