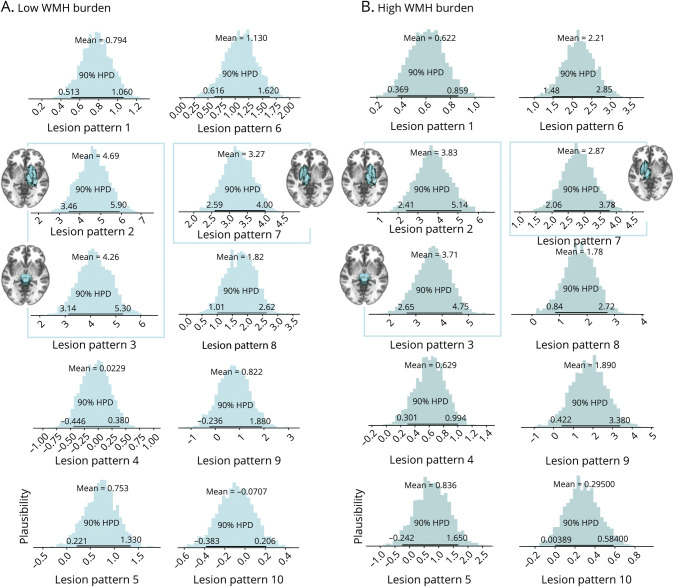
Figure 3. Bayesian Posterior Distributions Indicating Lesion Pattern Relevances in Explaining Stroke Severity in Patients With a Low (A) and High (B) Prestroke WMH Burden.
Six lesion patterns, lesion patterns 1, 2, 3, 6, 7, and 8, substantially explained stroke severity in both the low and the high WMH burden group, as indicated by the Bayesian posteriors distributions not substantially overlapping with zero (lower bound of the HPDI of the posterior distribution covering 90% certainty >0). The 3 lesion patterns with the highest overall weights, lesion patterns 2, 3 of the right hemisphere and lesion pattern 7 of the left hemisphere, are specifically accentuated, that is, framed and accompanied by brain renderings of the respective lesion pattern (low WMH burden: lesion pattern 2: mean of the posterior distribution = 4.7, 90% HPDI = 3.5 to 5.9; lesion pattern 3: mean = 4.3, 90% HPDI = 3.1–5.3; lesion pattern 7: mean = 3.3, 90% HPDI = 2.6 to 4.0; high WMH burden: lesion pattern 2: mean = 3.8, 90% HPDI = 2.4 to 5.1; lesion pattern 3: mean = 3.7, 90% HPDI = 2.7 to 4.8; lesion pattern 7: mean = 2.9, 90% HPDI = 2.1 to 3.8). Together, these 3 patterns predominantly featured the brainstem and bilateral subcortical gray matter regions (c.f., Figure 4A). HPDI = highest probability density interval; WMH = white matter hyperintensity.

