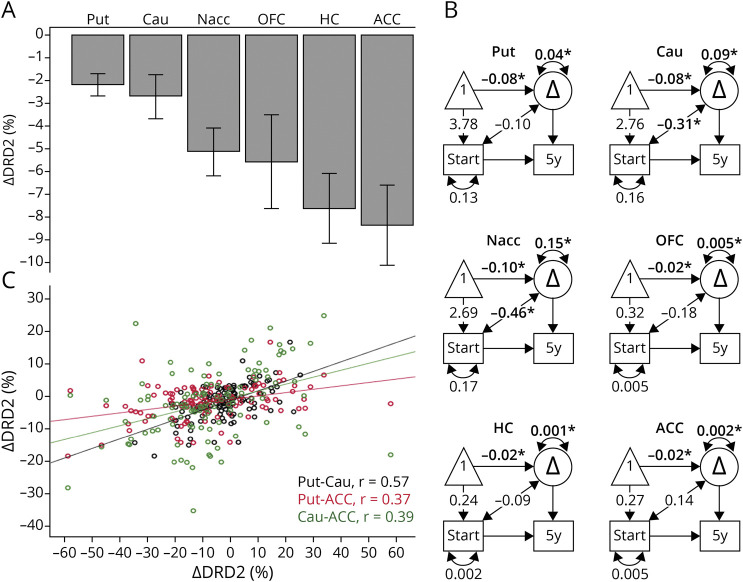
Figure 1. Five-Year Changes for In Vivo DRD2 Availability in Older Adults.
Significant change was found in the striatum, orbitofrontal cortex, hippocampus, and anterior cingulate cortex (A), with individual differences in rates of change (B). DRD2 changes correlated within the striatum and between striatal and select extrastriatal regions (C). *p < 0.05. In (B), observed variables are represented by a rectangle, a constant by a triangle, and change by a circle. One-sided arrows from constant to baseline and from constant to change represent mean levels at baseline and mean change, respectively. The 2-sided arrows between baseline and change represent correlations, and the 2-sided arrows above the change variables denote individual differences in change. Δ = change; ACC = anterior cingulate cortex; Cau = caudate; DRD2 = dopamine D2 receptor; HC = hippocampus; Nacc = nucleus accumbens; OFC = orbitofrontal cortex; Put = putamen; r = Pearson's correlation coefficient.

