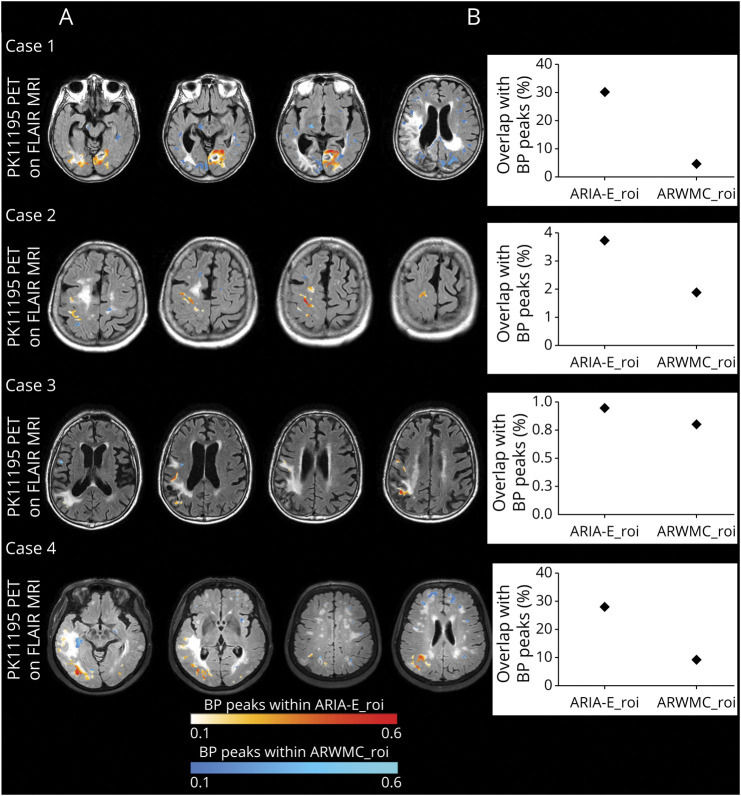
Figure 2. Microglial Activation Overlapping With ARIA-E and ARWMC at Baseline.
(A) The figure shows baseline 11C-PK11195 binding potential peaks (BP peaks) overlapping ARIA-E (ARIA-E_roi) and ARWMC (ARWMC_roi) regions of interest. For each patient, BP peaks were extracted from the same baseline BP peak maps displayed on the left lower rows of Figures 1–4 and superimposed on FLAIR images acquired at baseline. The intensity of microglial activation is represented using a yellow to red scale for BP peaks overlapping with ARIA-E_roi and a dark to light blue scale for BP peaks overlapping with ARWMC_roi. (B) Graphical representation of the percentage of spatial interaction between microglial activation and ARIA-E_roi and ARWMC_roi computed, respectively, as the total number of BP peaks and ROI overlapping voxels normalized to the number of voxels of the ROI. ARIA-E = amyloid-related imaging abnormalities suggestive of vasogenic edema; ARWMC = age-related white matter change; FLAIR = fluid-attenuated inversion recovery; ROI = region of interest.

