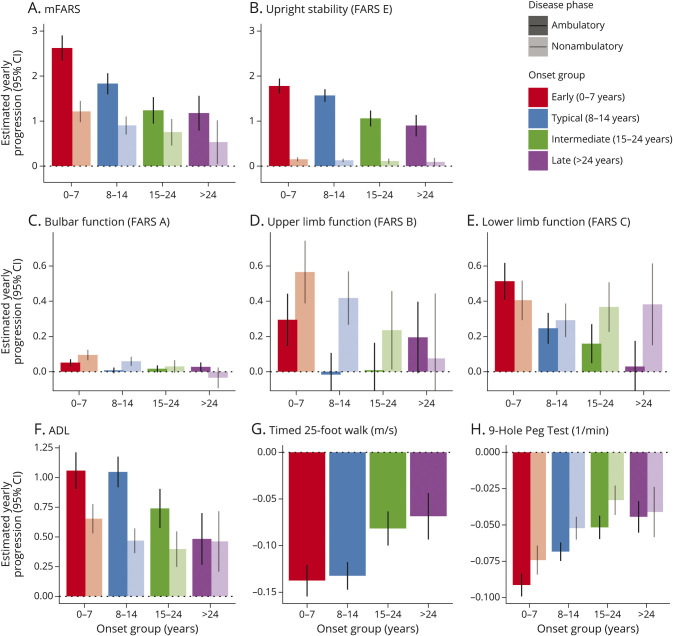
Figure 3. Estimated Yearly Progression by Onset Group and Ambulation Status.
mFARS (A), upright stability/FARS E (B), and FARS a, B, and C (C–E) activities of daily living (F), the timed 25-foot walk (G), 9-hole peg test (H). Note the differential y-axis scaling error bars represent 95% CIs. mFARS = modified Friedreich Ataxia Rating Scale.

