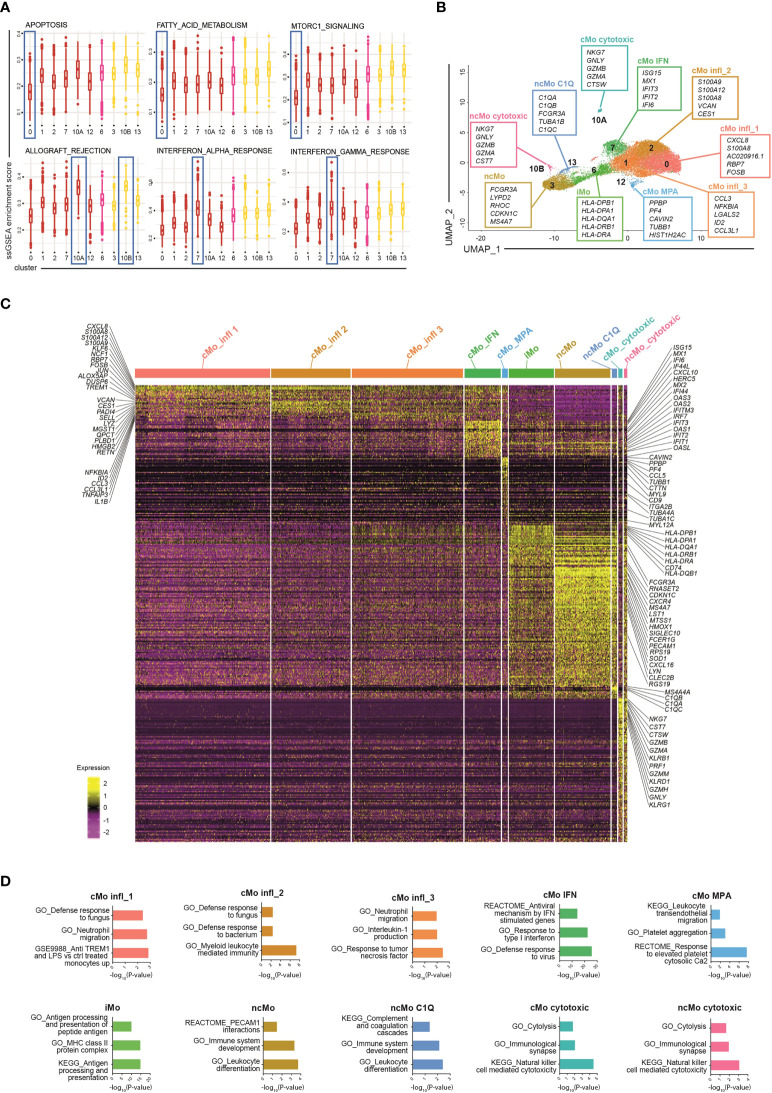
Figure 2.
Phenotypic characterization of human blood monocytes in steady state conditions. (A) Boxplot showing the normalized enrichment score (ssGSEA) of selected Hallmark signatures found differentially enriched in clusters belonging to the same monocyte macro-group (classical and non-classical monocytes). Colour code: dark red, classical monocytes; pink, intermediate monocytes; yellow, non-classical monocytes. (B) UMAP projection of monocyte clusters (c0, c1, c2, c3, c6, c7, c10A, c10B, c12 and c13). Up to five cluster marker genes are listed in boxes next to each cluster. Cluster marker genes are defined as in Material and Methods. (C) Single cell gene expression heatmap showing significant differentially expressing genes (pvalueadj ≤ 0.05, pct 1 ≥ 0.1, pct2 ≥ 0.1, log 2 FC > 0.5) among monocyte cell subsets. Selected gene names are labeled; gene expression is colored-coded from purple (lower) to yellow (higher); gene expression level is scaled by row. (D) Pathway analysis of differentially expressed genes (one cluster of monocyte vs all the other monocyte cells). Bar plots show key canonical pathways collected in The Molecular Signatures Database (MSigDB) enriched in individual populations of monocytes. The Canonical Pathways gene sets derived from the KEGG pathway database, the Canonical Pathways gene sets derived from the Reactome pathway database and the Gene Ontology gene sets were taken into consideration. Only upregulated genes were considered.

