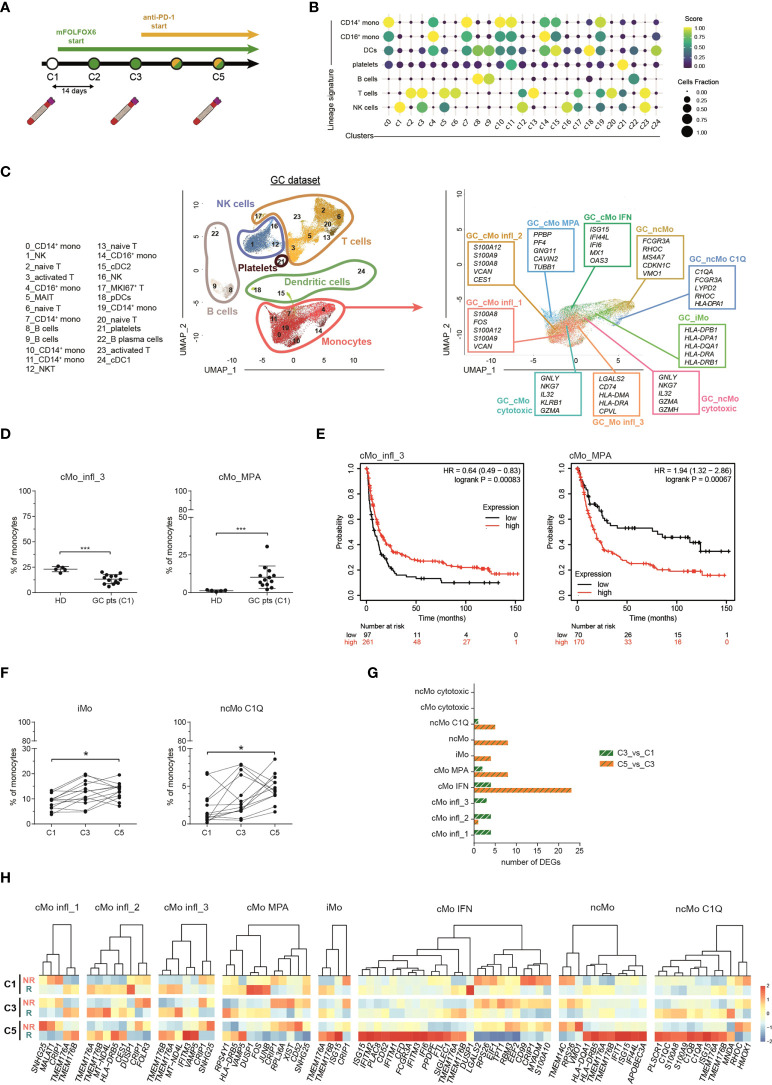
Figure 4.
Monocyte subsets in advance gastrointestinal cancers and response to immunotherapy. (A) Schematic illustration of the clinical trial treatment strategy adopted in the study of Griffiths and colleagues (Mod. from Griffiths et al., PNAS, 2020). Advanced GC pts received mFOLFOX6 chemotherapy at the beginning of the trial for 2 cycles (14 days per cycle). From cycle 3 through 12, they received the combination of mFOLFOX6 and anti-PD-1 immunotherapy. Blood samples were collected at C1 (cycle 1, baseline), C3 (cycle 3) and C5 (cycle 5). PBMCs were isolated and frozen. Single cell RNA sequencing was performed on the cryopreserved PBMCs samples using 10X Genomics technology and sequenced on an Illumina HiSEq. (B) Dot-plot showing annotated immune cells by lineage signatures (genes belonging to each signature are listed in Table S4 ). ssGSEA score-based signature expression is colored-coded from blue (lower) to yellow (higher); circle size indicates the fraction of cells expressing the signature. (C, left) UMAP projection of GC pts PBMCs (n = 55,293) showing 25 clusters individually annotated belonging to 6 major immune cell subsets. Clusters are numbered according to their size, from the largest (cluster 0) to the smallest (cluster 24). Each dot represents an individual cell. (C, right) UMAP projection of GC pts monocytes clustered using the machine learning classifier. Up to five cluster marker genes are listed in boxes next to each cluster. Cluster marker genes are defined as in Material and Methods. (D) Percentage of cMo_infl_3 and cMo_MPA over the total monocyte population from healthy donors and GC pts at C1. Statistical significance was determined by the Mann-Whitney test. (***) P < 0.001. (E) Kaplan-Meier curves of patient first progression survival defined by the cMo infl_3 signature (left) or the cMo MPA signature (right) using KMplot (34). Significance was evaluated by the log-rank Mantel–Cox test. (F) Percentage of iMo and nc_Mo C1Q over the total monocyte population in GC pts during therapy. Each line represents a patient percentage trend along the three therapy cycle steps. Statistical significance was determined by the Friedman test followed by Dunnett’s multiple comparison test. (*) P < 0.05. (G) Bar plot showing the number of significant differentially expressing genes after immunotherapy (green and white bars) and immunotherapy (orange and green pathways) in monocyte subtypes. (H) Heatmap showing the gene expression in C1, C3 and C5 of significant differentially expressing genes between responders and non-responders after immunotherapy. Gene expression is colored-coded from blue (lower) to red (higher); gene expression level is scaled by columns. C1, cycle 1 = baseline; C3, cycle 3 = chemotherapy mFOLOFX6 regimen; C5, cycle 5 = chemotherapy + anti–PD-1 immunotherapy. HD, healthy donors; GC pts, gastrointestinal cancer patients. NS, non-responder patients; R, responder patients.

