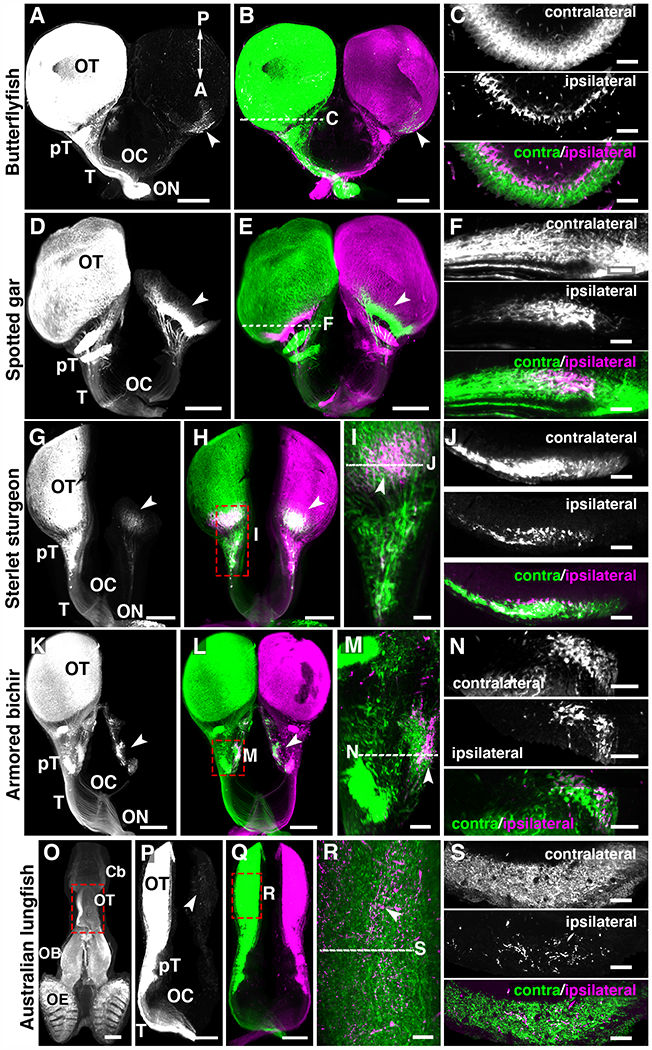
Fig. 2. Bilateral visual projections in basal ray-finned fishes and lobe-finned fishes.

(A to S) 3D light-sheet fluorescence microscopy images of iDISCO+ cleared brains from fish injected into the eyes with 2 cholera toxins. The left panels show only one channel. (C, F, J, N and S) are optical sections through the brain region receiving bilateral visual inputs. (I and M and R) high magnification from whole-mount brains. (A to C) Butterflyfish. (D to F) Spotted gar. (G to J) Sterlet sturgeon. (K to N) Armored bichir. (O to S) Australian lungfish. (C, F, J and N) In all fishes, contralateral and ipsilateral projections segregate in two different optic tectum (OT) layers except in the lungfish (S) where they are intermingled in the OT. Arrowheads indicate ipsilateral projections. Abbreviations: Cb, Cerebellum; OB, Olfactory bulb; OE, Olfactory epithelium; ON, Optic nerve; OC, Optic chiasm; pT, pretectal nuclei; T, Optic tract. Scale bars are 500 μm in (A, B, D, E, G, H, K, L, P and Q) and 80 μm in (C, G, K, N and S) and 100 μm in (M, O) and 150 μm in (I, R).
