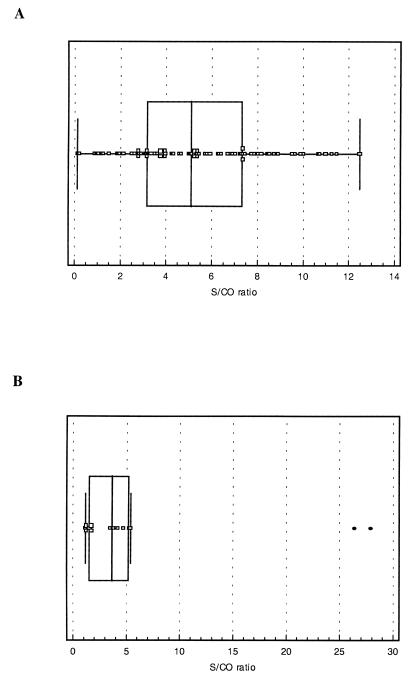
FIG. 4.
(A) Box-and-whisker plot of the ELISA data (S/CO) for the sheep sera with AGIDT-indeterminate results. Median and 25th, and 75th percentiles (boxes), as well as the minimum and maximum values, are indicated. (B) Box-and-whisker plot of ELISA results (S/CO) for 14 goat sera that were AGIDT negative. The two outliers with S/CO between 25 and 30 were not included in the calculations of the median and the percentiles.

