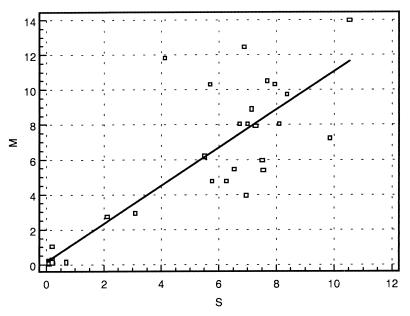
FIG. 6.
Correlation between ELISA results obtained with serum and milk samples from the same animals (n = 40). S/CO were plotted on the x axis for serum (S) and on the y axis for milk (M). Cutoff was at an S/CO of 1 in both cases. The linear regression line is also shown (r = 0.89). Influence analysis has not shown significant bias on the correlation by one or more data points.

