Figure 7.

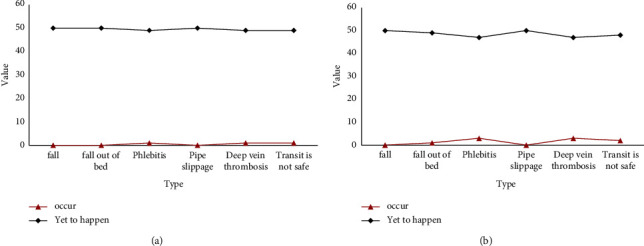
Comparison of the incidence of specific risk events between the two groups. (a) The incidence of specific risk events in the experimental group. (b) The incidence of specific risk events in the control group.

Comparison of the incidence of specific risk events between the two groups. (a) The incidence of specific risk events in the experimental group. (b) The incidence of specific risk events in the control group.