Fig. 5.

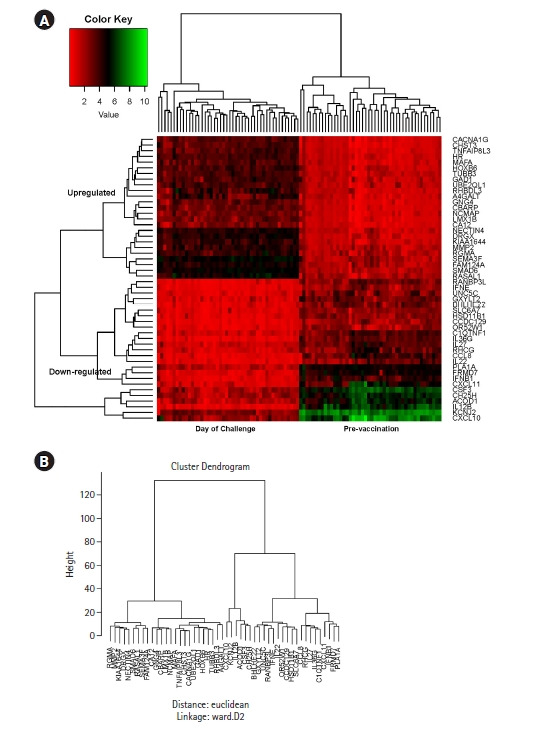
Heatmap (A) and dendrogram (B) generated by Hierarchical clustering based on top 50 significantly differentially expressed genes, illustrating the distinct clusters of control and controlled human malaria infection day samples.

Heatmap (A) and dendrogram (B) generated by Hierarchical clustering based on top 50 significantly differentially expressed genes, illustrating the distinct clusters of control and controlled human malaria infection day samples.