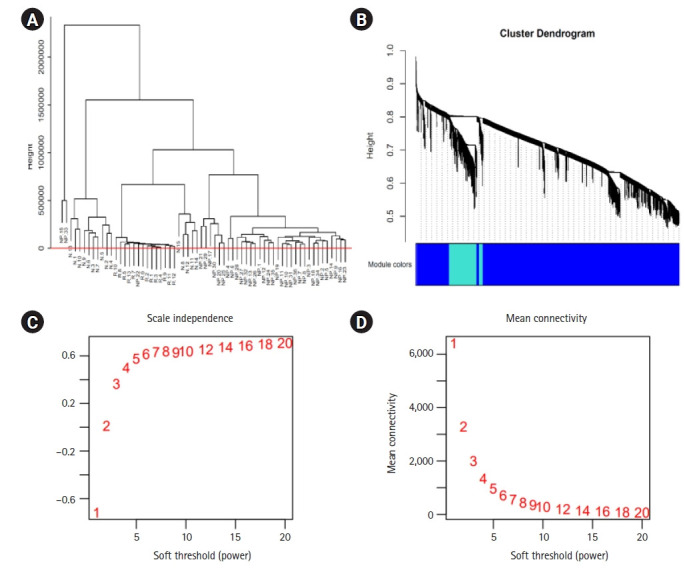
Fig. 3.

(A, B) The dendogram tree of the samples in the study clustering dendrogram of genes, with dissimilarity based on topological overlap. N, neuropathy; R, retinopathy; NP, nephropathy samples. (C, D) Analysis of network topology for various soft-thresholding powers. The left panel presents the scale-free fit index (y-axis) as a function of the soft-thresholding power (x-axis). The right panel displays the mean connectivity (degree, y-axis) as a function of the soft-thresholding power (x-axis).
