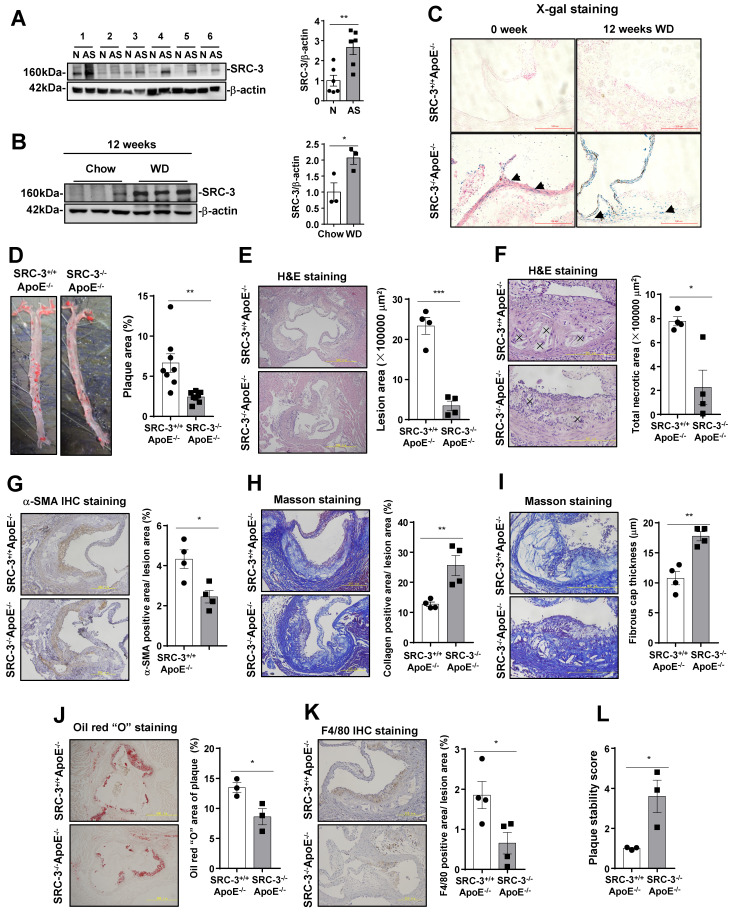
Figure 1.
SRC-3+/+ApoE-/- mice exhibit more severe atherosclerosis. (A) SRC-3 was highly expressed in human atherosclerotic plaques. N represents plaque-adjacent vasculature in the lower limb aorta. AS represents atherosclerotic plaques in the lower limb aorta. (B) SRC-3 expression was upregulated in the aortas of ApoE-/- mice after the mice were fed a WD for 12 weeks. (C) SRC-3 was expressed in the endothelial cells and vascular smooth muscle cells of chow-fed SRC-3-/-ApoE-/- mice and was further increased after the mice were fed a WD for 12 weeks. Sections of frozen aortic roots from SRC-3+/+ApoE-/-and SRC-3-/-ApoE-/- mice were subjected to X-gal staining. Arrows indicate positively stained cells (blue). Scale bar, 100 µm. (D) SRC-3 promoted atherosclerotic plaque formation. Representative images of en face Oil Red O-stained aortas from SRC-3+/+ApoE-/- and SRC-3-/-ApoE-/- mice (left panel). Quantification of the plaque areas in aortas (right panel). (E-K) Cross-sections of the aortic roots from SRC-3+/+ApoE-/- and SRC-3-/-ApoE-/- mice were subjected to (E-F) H&E staining (scale bar, 500 µm (E); scale bar, 200 µm (F)), (G) α-SMA staining (scale bar, 200 µm), (H-I) Masson staining (scale bar, 200 µm (H); scale bar, 200 µm (I)), (J) Oil Red O staining (scale bar, 500 µm), and (K) F4/80 staining (scale bar, 200 µm). Left panels, representative images. Right panels, quantification of stained area or a percentage of lesion area. “×” indicates necrotic area. (L) Plaque stability was significantly increased in SRC-3-/-ApoE-/- mice. The data represent the mean ± SEM. The results are representative of three independent experiments. P values were calculated by unpaired two-tailed Student's t-test. *, P<0.05; ** P<0.01.

