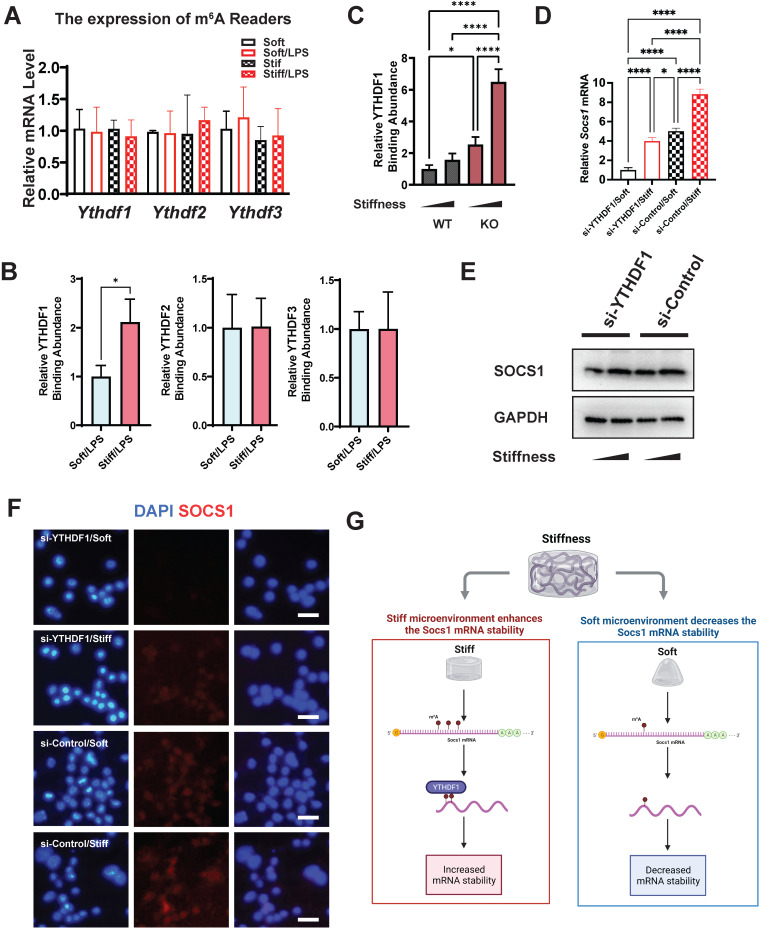
Figure 7.
YTHDF1 is the m6A reader, which regulates SOCS1 expression via stiffness sensing. A. RT-qPCR quantitation screening the effect of stiffness on the gene expression of m6A readers (Ythdf1, Ythdf2, and Ythdf3); data are for three independent experiments. B. RIP-qPCR quantitation screening the effect of stiffness on the quantity of m6A readers (YTHDF1, YTHDF2, and YTHDF3) and Socs1 mRNA complex; data are for three independent experiments. C. RIP-qPCR quantitation illustrating the effect of FTO-KO on the quantity of YTHDF1 and Socs1 mRNA complex; data are for three independent experiments. D. RT-qPCR quantitation illustrating the effect of si-YTHDF1 on the expression of Socs1 transcripts under the effect of stiffness; data are for three independent experiments. E. Western blot showing the effect of si-YTHDF1 on SOCS1 expression in macrophages on stiff/soft hydrogel. F. Colour-coded representative images of LPS-treated WT and FTO-KO macrophages on soft or stiff hydrogel stained for SOCS1 and DAPI; scale bar, 20 µm. G. Scheme showing the effect of stiffness on the YTHDF1 and Socs1 mRNA complex, created with BioRender.com. For two-group comparison, a Student's t-test was applied for testing the significance with *p < 0.05; for comparison with groups (>2), a one-way ANOVA with post-hoc multiple comparisons (Tukey's HSD test) was used for testing significance. *p < 0.05, **p < 0.01; ***p < 0.001; ****p < 0.0001.

