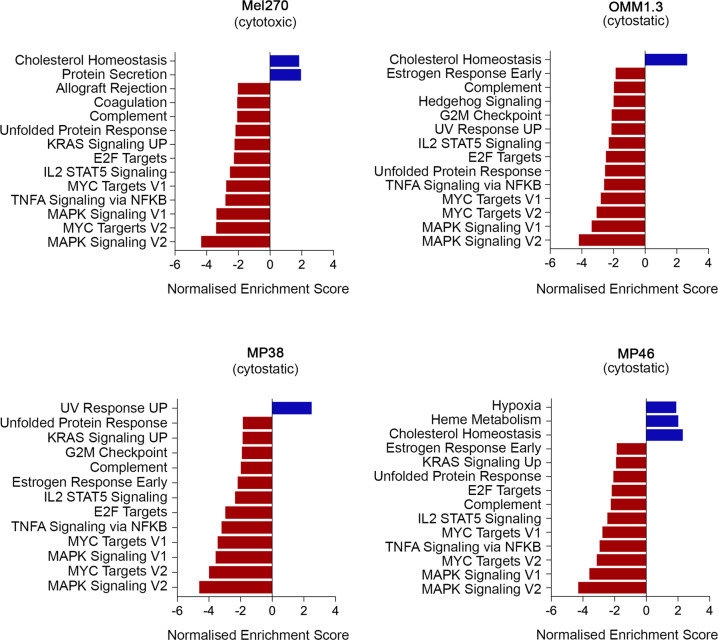
Fig. 6. PKC inhibition represses transcriptome genesets indicative of proliferation and MAPK signaling in responsive and sensitive UM.
Geneset enrichment analyses was performed using GSEA PreRanked mode and the Hallmark gene set with additional signatures indicative of MAPK and YAP activity, was used to identify gene signatures that were differentially expressed between control versus IDE196 (5 µM) inhibitor-treated (8 h, 16 h, and 24 h treatment time points were combined) UM cells. For each cell line the differentially expressed genes were ranked and selected based on an FDR-adjusted p-value < 0.05. The complete geneset enrichment analysis data are shown in Tables S2–S5. PKC inhibitor treatment of the resistant Mel285 UM cell line did not produce any significant changes in transcriptome signatures.

