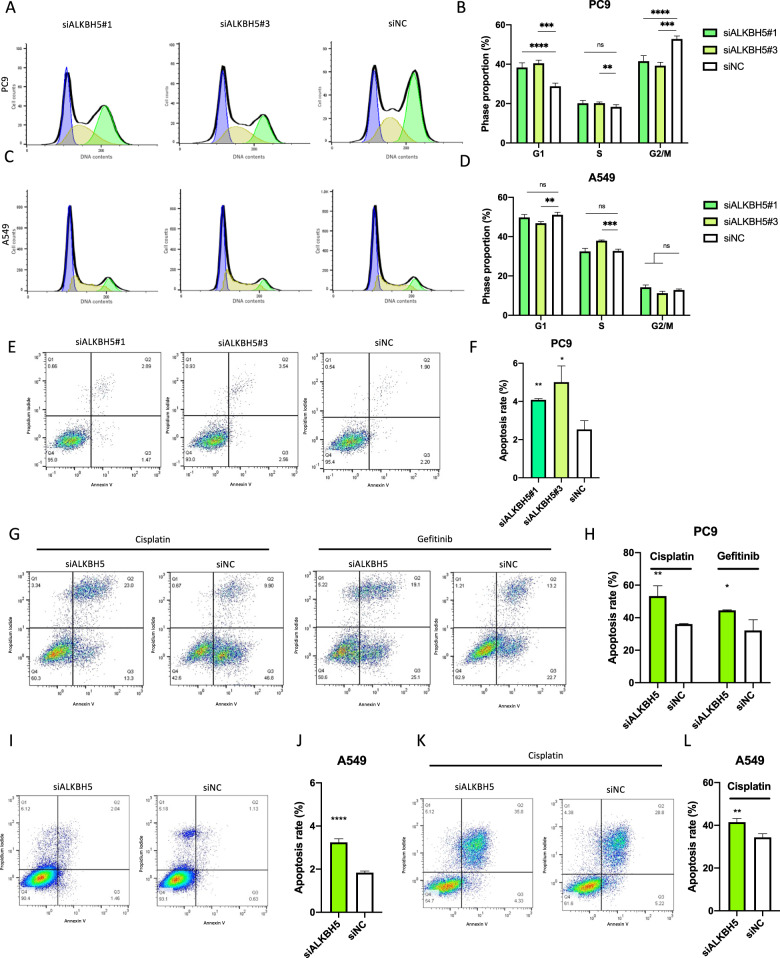
Fig. 3. ALKBH5 knockdown-induced G1 phase arrest of cell cycle and/or apoptosis in non-small-cell lung cancer.
A–D The cell cycle was examined via flow cytometry with PC9 (A) and A549 (C) cells transfected with siALKBH5 (#1 and #3) or siNC. The bar charts indicate the percentage of cells in each cell cycle phase [n = 6 for PC9 (B), n = 3 for A549 cells (D)]. E, F Apoptotic cells were determined using flow cytometric analysis of PC9 cells transfected with siALKBH5 (#1 and #3) or siNC. E Percentage of the apoptotic cells in which both propidium iodide and annexin V were positive are shown in a representative scatter plot. F The apoptosis rate in ALKBH5 knockdown was compared with siNC and shown as a bar chart (n = 3). G, H Cisplatin- or gefitinib-induced apoptotic cells were determined via flow cytometry with PC9 cells transfected with siALKBH5 or siNC. G Percentage of apoptotic cells shown in a representative scatter plot. H The cisplatin- or gefitinib-induced apoptosis rate in ALKBH5 knockdown was compared with siNC and shown as a bar chart (n = 3). I, J Apoptotic cells were determined via flow cytometry with A549 cells transfected with siALKBH5 or siNC. I Percentage of the apoptotic cells shown in a representative scatter plot. J Apoptosis rate in ALKBH5 knockdown was compared with siNC and shown as a bar chart (n = 6). K, L Cisplatin-induced apoptotic cells were determined via flow cytometric analysis of A549 cells transfected with siALKBH5 or siNC. K Percentage of the apoptotic cells shown in a representative scatter plot. L The cisplatin-induced apoptosis rate in ALKBH5 knockdown was compared with siNC and shown as a bar chart (n = 3). Results were presented as mean ± SD. *P < 0.05, **P < 0.01, ***P < 0.001, ****P < 0.0001 indicates a significant difference between the indicated groups.

