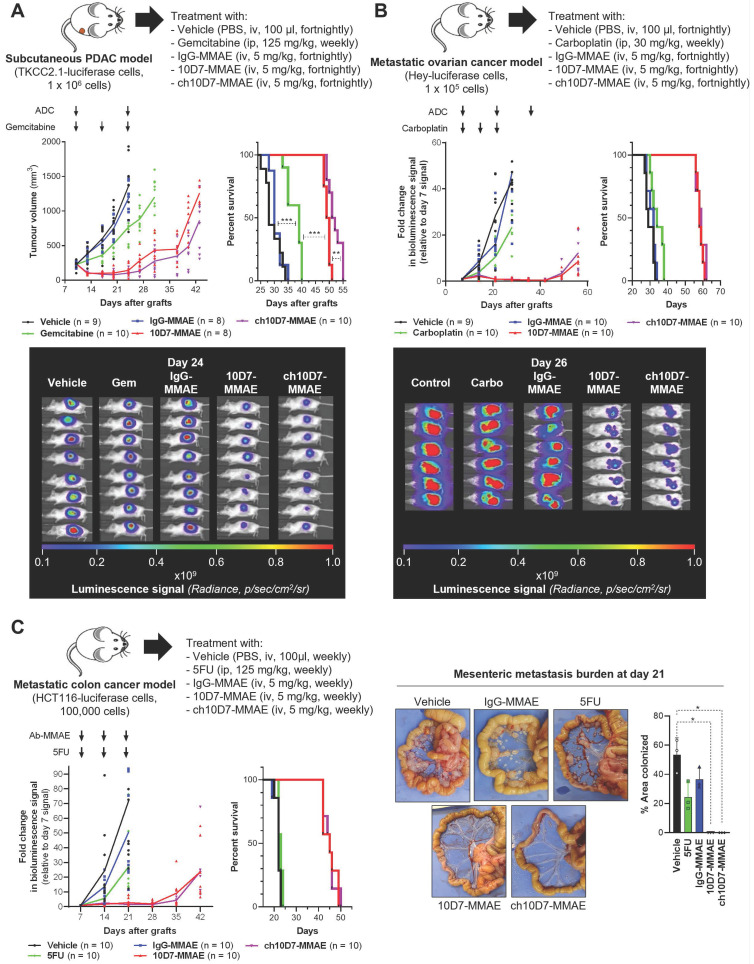
Figure 5.
Efficacy of ADC ch10D7-MMAE in in vivo cancer models. Presented for each model: Top, Schematic of the experimental protocol including xenograft site, cancer cell line and treatment regimen; Bottom left: Graph of tumor burden versus time for each treatment group; Bottom right, Kaplan-Meier survival curve of mice in each treatment group. A. Preclinical model of PDAC involving subcutaneous xenografts in NSG mice of TKCC2.1 cells (1x10⁶/mouse; 8-10 mice/group). Once tumors reached 200 mm3 mice were randomized then treated with ADCs every two weeks (5mg/kg i.v.), weekly gemcitabine (125mg/kg i.p.) or vehicle control. B. Preclinical model of ovarian cancer involving intraperitoneal xenografts in NSG mice of luciferase labelled HEY cells (1x10⁵; 9-10 mice/group). One week after injection of cells mice were randomized then treated with ADCs every two weeks (5mg/kg i.v.), weekly carboplatin (30mg/kg i.p.) or vehicle control. C. Preclinical model of metastatic colorectal cancer involving intraperitoneal xenografts in NSG mice of luciferase labelled HCT116 cells (1x10⁵; 10 mice/group). One week after injection of cells mice were randomized then treated with ADCs every two weeks (5 mg/kg i.v.), weekly 5FU (125 mg/kg i.p.) or vehicle control. For subcutaneous xenografts, tumor burden was measured twice weekly using calipers, while tumor burden for intraperitoneal xenografts was measured by weekly bioluminescent imaging. Once mice in any group required euthanasia due to disease burden, treatments were stopped, and survival followed. Statistical significance of the survival analysis was assessed using Log-rank Gehran-Breslow Wilcoxon Chi2 test.

